Thursday, August 30, 2012

Nowhere to hide

With the depression slowly engulfing more and more European nations, should you place your bets on Asia? It's easy to assess the growth of Asia since most of these countries are export hogs. Their GDP numbers, though correct, can mislead us into thinking that they have the answer to the crisis. Actually, they are all borrowing their way to growth, either through government debt or household debt or a combustible mix of both. Instead, a better indicator of their economic health is the level of their forex reserves (chart at left from The Financial Times).

With the US current account deficits already slowing down, no country can expect to increase its forex reserves. Now the three major South-east Asian economies of Indonesia, Thailand and Malaysia have started running down their reserves while Asia's two major powers, China and India are seeing their reserves increasing at a slower pace. China is the worst of the lot, with all sectors of the economy heavily in debt.

China's latest balance of payments (chart at left from The Economist) confirms that even its forex reserves have started to decline mainly because of capital flight, a problem you'd usually associate with Greece or Spain. Do the rich Chinese know something which the China bulls are still in denial of?

If you think that you can sleep soundly after moving your investment to these countries, you'd better put on a pair of good earmuffs. There are still many shoes waiting to drop.


Tuesday, August 28, 2012

The last of the financials

Why has the financial sector grown so big in so short a period, that is, in less than 30 years? In fact, before the recent housing bubble bust, the financial sector was the employer of choice for most of the MBA graduates from the top business schools in the US.

Looking at the longest recorded stretch of the credit picture in the US (see chart from The Financial Times below), dating back to 1870 but with the debt components tracked only from 1929, it's evident that debts prior to the 1930s never amounted to twice the GDP. Even though we don't have the breakdown of the debt components prior to 1929, we can reasonably infer that they were stable throughout that period because total debt grew at a measured pace. And the financial sector borrowings, i.e., excluding the customer deposits placed with it, had always remained relatively small even during the Great Depression of the 1930s. So generally banks then financed themselves using equity.


As can be seen in the above chart, the main financing during the 1930s was raised directly by the non-financial corporations in the form of bonds. The corporations lent the money to brokers who relent it as 90% margin loans to their clients who ultimately speculated on the stock market. The failure of these loans however was only a secondary cause of the 1930s Great Depression — the primary cause of all economic depressions has always been excess capacity. Since then, the non-financial corporations have learned their lesson by keeping their debt leverage to reasonable levels.

During the Great Depression, as the non-financial corporations raised bonds directly, the banks, deprived of their traditional loan business to corporations, bought the corporations' bonds. They also wrote loans with only 10% margin requirements to buyers of stocks. About 40% of their loans went to financing stock speculation.  Not content with that, they also speculated directly in stocks. Their participation in this speculation and its financing eventually led to the failure of 10,800 banks. Because of their leverage, the banks are the first to fail — and they fail big — in any economic depression, that is, a condition characterised by a substantial collapse in money supply.

Up until the turn of the 20th century, the banks' leverage was much lower. Their capital ratio was never less than 20% (see chart at left from The Economist depicting the percentage of book equity to book assets, this approximating the capital ratio). However a high capital ratio means a bank has to use more of its own capital which is not as rewarding as using other people's money (OPM) — mainly customer deposits — because the cost of OPM is much lower. A low capital ratio therefore translates into more profits for the bank shareholders, provided the money supply keeps growing at a healthy pace.

But one thing obvious from the above chart is that the banks' capital ratio during the Great Depression was much higher that at any time since. Therefore insisting on the banks to increase their capital ratio wouldn't necessarily shield them from future crises though it may lower the risk of failure, albeit only marginally. However banks in the 1930s were not as big as they are now though there were many, about 25,000. With low capital requirements then, setting up a bank was easy.

There are two intriguing questions here. One is why the finance sector only becomes big now. The other is why the current depression unfolds over a prolonged period rather than like the quick bust of the Great Depression. Remember that the start of this depression can be traced to the collapse of the Japanese stock market towards the end of 1989. For the US, the Dotcom bust in 2001 is the  the starting point. For this post, we'll answer the first question. The second will follow in the next post.

The problem with being big is that once you've tasted bigness, you're loath to scale down since size has its own benefits. But in an economic depression, size doesn't guarantee safety. It just makes the fall that much more catastrophic. The government has to step in to rescue no matter what.

The case of Lehman Brothers is instructive. When Lehman failed exactly four years ago, it had $660 billion worth of assets at book value, making it the biggest corporate bankruptcy in history. Because banks cross-lent to one another extensively, the US Treasury's decision to let Lehman fall soon led to to the seizure of the money market. Market participants pulled back their lending, scared that the counter-parties might go belly up. Only a $9 trillion guarantee and overnight loans by the Fed restored market normalcy. This rescue was never made public; only the much smaller $700 billion TARP rescue fund was. Helped by Obama's four straight years of annual deficits exceeding $1 trillion each, the banks have managed to regain ground and the Fed its money.

We can be sure that the next time around, the Fed won't let another Lehman fall. But by letting the banks grow, the Fed is in thrall to the big banks. However with the depressed state of the economy even four years after the Lehman collapse, the politicians and the Fed have squandered whatever political capital they have left. So it's arguable whether the public can stomach another Lehman-type rescue by the Fed though it's in its interest that the Fed does so.

The debt picture doesn't tell how exactly has the financial sector grown because it looks only from the credit side. We need to see the obverse of debt, that is, the asset or debit side. The chart below from The Economist shows that the financial sector's assets started their relentless increase beginning in the mid 1980s. Now if you look at the debt chart above, you'd notice the similarity in the movements. Bear in mind that both charts reflect the amount as a percentage of GDP. So any movement above 100% means that the assets or debts increase at a faster pace than that of the GDP. The assets are however greater than the debts. This can be easily accounted for by equities which are the only financial assets that are not debts.


Technically, equities perform the same function as money except that they are safe money unlike debts which are toxic money, that is, in conditions of declining money supply. In the lead to a depression, the value of equities will fall but debts retain their value until the moment it becomes unsustainable and snaps. That's why the values of all financial assets and commodities can suddenly plunge.

To be sure, the banks began their growth after the 1973 oil crisis when the US started to suffer increasing trade deficits. The wealth generated by those deficits went to the oil producers who deposited them back with the US banks. But the 1970s were the days of high inflation, so the debt value as a percentage of GDP was contained.

However by 1981, the inflation was brought down by Paul Volcker's harsh interest rate regime. Unknown to many, more influential was the extra capacity brought on by the oil producers who by then had substantially increased both oil production and spare capacity. Essentially since then inflation has been much subdued because technology and globalisation have both been unleashing limitless capacity. Even when commodity prices have gone up, inflation has never reared its ugly head. But inflation did appear in short and sharp bursts particularly for those countries that suffered severe debt crises, such as Korea, the South-east Asians, Sweden and more recently Iceland. Their inflation came stealthily through currency devaluation which was a one-off event, after which price levels stabilised.

It is this low inflation environment that has accommodated the big increase in credit supply and on its heels, the burgeoning financial sector. In an inflationary environment, holding on to financial assets can be detrimental because they may lose value faster than real assets. In contrast, a low inflationary or, worse, deflationary environment favours creditors since their debts hold value even when prices are crashing everywhere. This tremendous debt increase has enabled all sorts of financial outfits — ABS pools, hedge funds, pension funds, and many others — to proliferate and some to grow big.

How will the financial sector evolve once the money supply settles to its natural level? The most vulnerable will be the big banks. When the Fed provided financial assistance during the 2008 financial crisis, it should have been made conditional upon the banks eventually splitting themselves, if for no other reason than facilitating the banks to be shuttered when money supply plummets. The investment banks are already planning to reduce their assets by $1 trillion and costs by $10 billion over the next two years. Whether such reductions are sufficient remain to be seen.

Even George Soros last year returned his investors all their money, foreseeing that there was no money to be made when money itself would disappear. But big funds such as the pension retirement funds are putting more of their assets into hedge funds hoping the hedge funds could outfox the market. The right thing to do should have been to close down the retirement funds and distribute the capital to the retirees, letting them manage their own money. These retirement funds are at risk of being wiped out in the coming money disappearing act.

When these giant financials are gone, there is very little likelihood that they will make a comeback in the Fifth Kondratieff Wave. The new investment of this final wave no longer favours the accumulation of large capital. In future big production facilities will be passe when 3D printing can produce items economically in units of one. Mineral commodities except gold and silver will best be left underground as nanomaterials with better material properties enter commercial use and renewable energy takes centre stage.

As this depression progresses, bid farewell to the financial giants; we'll never see the likes of them again.

Monday, July 30, 2012

Downsize or doze off

Banks are being chastised from all and sundry for their misdeeds and blunders. Now even Sandy Weill, the person credited for creating the Citigroup behemoth, has been calling for banks to split their commercial arm from their investment trading arm. The common justification put forward for the split is the different cultural attributes of a bank's investment and commercial arms.

Actually, the split or the sizing down of banks should not be precipitated by the huge trading losses or the Libor rigging scandal. Warren Buffett has observed that, "Only when the tide goes do you discover who's been swimming naked." Indeed an op-ed piece in the Financial Times confirms that the banks have been rigging the Libor for more than 20 years. Bob Diamond and his ilk, the regulators and the central bankers have known this all along. The parliamentary committee hearing was a sham to provide cover for everybody's ass. The reason this scandal wasn't exposed earlier is because the tide was still up. As the tide recedes, all the skeletons will start walking out of the closet

As for the differing cultures, they can be easily managed by having separate organisational setups that don't mix the two. The only reason that compels a bank to downsize is much deeper than these specious arguments. To understand why, we must delve into the bank's ecophysiology, not philosophy since there's nothing philosophical about overly paid bankers making money from borrowing cheap and lending dear, or betting on market movements.

Like any living things, a bank grows big if its food is aplenty. Similarly, if food is scarce, it must start scaling itself down. Sizing down entails shrinking a bank's loan asset base by recalling loan assets that pose great risks. Income will fall but in these depressing times, growth and income are the least of a bank's priorities; survival is the most pressing.

It's been observed in evolution that mammals above the size of rabbits living on islands would diminish in size (see The Island Rule). To remain big and active in times of scarcity is an invitation for disaster. A bank's food is the money supply, the best measure of which is total credit. If you look at the total credit picture for the US, the picture appears bleak, more so with the recent second quarter 2012 GDP growth turning south.

Obama's deficit spending only manages to slow down the slide and the resulting bank failures (see right table). But as its impact will soon start to wear off with the declining deficits, the descent will resume its previously steep decline. The eurozone total credit has crumbled in Italy, Spain and Greece with more states joining in. Whenever total credit crashes, banks will be the first to be hit because of their gearing.

We also should be aware by now that Bernanke's QE won't work. If only someone would sock it to Bernanke that his QE actually means quantitative exchange, that is, a swapping of debts on the scale of trillions of dollars, maybe he'll wise up to the fact that QE doesn't print money. QE works only to stem a panic, that is, when a bank is in imminent danger of collapse. The bank can swap its less liquid assets for liquid money from the central bank. But if the bank has assets that have hugely lost their value, there's nothing to prevent its collapse except by a takeover by the state. And if the state itself is in a wreck, the mess multiplies severalfold. Now, this latter scenario is going to haunt the banks as round two of the economic depression starts to unfold.

The other alternative to sizing down for a bank is powering down its thermal engine through hibernation. A bank can power down by switching its loan assets to low-return Treasury bonds and bills and aggressively paring its operating costs through salary and bonus cuts. After all you don't require smart people in banking; banking is best served by staid and conservative characters. No matter how pristine the quality of a bank's loan assets is now, it will be tarnished once total credit resumes its downward slide. By then it'll be too late to unload the assets at good prices as all banks will be rushing for the exit. The sight of panic, naked bankers is not something you'd want to behold.

Tuesday, July 24, 2012

Baltic austerity "success"?

Two Baltic countries, Estonia and Latvia, have been recently touted as the poster children of austerity. Even Paul Krugman who tried to play down the success of Estonia has been chided in several twitter comments by none other than the Estonian President himself. For a president of a sovereign state to stoop so low is demeaning to the office of a president. Unless you take into account a few facts regarding that sovereign state.

To start with, the problem lies with presenting only half-truths which are quite common with statistics. Half-truths are in fact worse than outright lies. At least with lying, you know that the facts are false but with half-truths, the facts are, well, facts but only selectively disclosed. You don't know what's hidden and if you're like Krugman, you'll be stumped.

The Council of Foreign Relations has produced the following chart as evidence that the Baltics have performed better economically than Iceland and Ireland, two troubled states that are still recovering.


For Latvia, the Financial Times has an excellent op-ed piece, 'Latvia is no model for an austerity drive' written by Michael Hudson and Jeffrey Sommers. Sommers also has written a similar piece, 'Latvia's fake economic model' in the CounterPunch newsletter. We don't need to elaborate further on what they have written but there are other relevant facts that should've been highlighted to enable us to view the issue in the right perspective.

For this, I've summarised on the left the 2011 GDP, population size and GDP per capita of the two Baltic states that supposedly have successfully undergone the austerity regime plus those of the PIIIGS, that is, including Iceland.

Though both Estonia and Latvia are sovereign states, their population sizes are no more than that of a city. Worse, the three Baltics states, i.e., including Lithuania, have been suffering a population loss of more than 1.5 million or 15% since 1990. That loss is the fastest in Europe.

Now look at the GDP size. For both Baltic states, a 10% increase in GDP amounts to less than 1% of Greece's GDP. Even their GDP per capita is much less than that of the other economically problematic European states. With such low starting bases, it's easy to go up. Living next door to rich neighbours to their north and west, there's bound to be some economic spillovers from them, especially with the Baltics' relatively low labour cost. Simply plonking a few export generating factories can easily boost their GDP. Even any bailout fund is small change for their big neighbours.

If Iceland, another small state but with high GDP per capita, were to adopt the austerity regime instead of close to a 50% devaluation, the economy would have collapsed because the alternative would have been a 50% across-the-board cut in wages. Still, the foreign debts of its venturous and now collapsed banks remain unpaid. But at least with the devaluation the local debts can be easily managed or even paid off. That should've been the first step in any economic recovery process: whittle the debts through either debt write-offs or high inflation which is synonymous with currency devaluation.

In another related matter, Angela Merkel early this month commended Bulgaria for its fiscal virtue. Let's see how do Bulgaria's statistics rank with the others. Its 2011 GDP is $53.51 billion while its population is 7.476 million, giving it a GDP per capita of just $7,160. Comparing apple with orange may not be right but probably still acceptable. But this not even orange, it's peanut. Are the eurozone leaders taking us for monkeys?

Sunday, July 8, 2012

The quest for bounty

The world population now has passed the 7 billion mark. Although food production in modern times has generally surpassed demand, the margin of safety is very small. The latest numbers for 2011 show that cereal production (2,344 million tonnes) exceeded demand (2,325 million tonnes) by less than one percent. Despite this surplus, one billion people are suffering from malnutrition while at the opposite extreme, one billion are afflicted with obesity. Although the chief fault lies with distribution which is not equitable, food production yield in its current form is itself approaching the tail-end of the proverbial S-curve.

The world's longest-running research on wheat yield has been conducted since 1843 at Broadbalk field, which lies within Rothamsted Research, an agricultural research station in the UK. Its record of wheat yields (see chart at left from The Economist) is instructive. After the discovery of guano in the 1830s followed by Chilean nitrate in the 1870s, progress in wheat yield as well as those of other cereal crops since then had been static for more than 100 years. During this period, increasing the food production depended on the opening up of new lands, which were in abundance, for cultivation. Since the advent of the Industrial Revolution, new farmlands have been created in the American Midwest, followed by the Canadian prairies, Ukraine, Australia and New Zealand. Consequently, the growth in food production before the Green Revolution of the 1960s was derived not from higher yield but from increased acreage. This explains why Hitler wanted to expand east lest Germany ran out of space for food production.

There was technological progress then but its main impact lay not in increasing yield but productivity through the replacement of farm labour and animals with machinery. Mechanisation started with the use of animal power, specifically, the horse. The early animal-powered machine began with the reaper (1830s), then the reaper-binder (1870s) and when it finally included threshing technology, it became known as the combine harvester (1880s). When the steam engine came along, it didn't totally replace the horse because the heavy weight of the machinery made it unwieldy on the farm.

As a result the steam engine was generally operated from a fixed position. In Britain because of the soft ground, the steam-powered machinery was stationary and a cable was used to pull ploughing or cultivating implements across the field. In this case, two steam engines located on the opposite ends of the field and attached with a winch each would pull the implements first in one direction, and then the other. However in the US, the fields being of hard ground, the steam tractor itself would haul the plough. The steam tractor also pulled steam powered combine harvester but its productivity improvement over the horse powered was only one third. However the benefits of replacing horses were realised not only in the form of greater workload capacity but also in the increased availability of land, about 25% more; this being the result of land formerly used to grow animal feed now switched to human food. The introduction of the lightweight gasoline-powered tractors in the 1910s offering vastly greater productivity eventually totally replaced both steam engines and draught animals.

Such mechanical innovations which have largely run its course are the root cause of the decline in US agricultural employment since the 1840s (see chart below from the MinnPost). The Green Revolution which started in the 1960s contributed only a minor portion to the decline. Similar employment busting trends which have afflicted manufacturing since the 1950s are now plaguing the services sector, read the government sector since it is turning out to be the biggest employer in this depression if you also include the private sector employment that depends on the expanding largesse of government deficits. In time this will leave the government prostrate which should see to the decline of the services sector jobs.


The increased production from the new fields would have amounted to nothing had not advances in communication, food storage, and food processing technology progressed alongside to ensure that the surplus production was transported and distributed to those able and willing to consume it. However, it was the communication aspect that played the most prominent role in ensuring the uptake of US grain by other countries. As usual, major changes in communication can be segmented into periods that correspond with the Kondratieff Waves timeline.

The First Kondratieff Wave was set in motion in Britain, the cradle of the Industrial Revolution. But it didn't take long for the US to latch onto the Kondratieff Wave bandwagon. By the Second Kondratieff Wave, the US would overtake Britain in all aspects of the 4Cs.

Grain grown in the Midwest had to be transported through the Erie Canal—which had been completed in 1825—to New York before being shipped to Europe. Even though rail technology already existed, it was used only for short distant travel because the wrought iron used could not bear the high pressure of the steam boilers nor the weight of the railcars. Only when steel was introduced, could the railways effectively end the commercial use of the Erie Canal sometime in the 1880s. Long before the canal construction, the grain producing centres had moved from New York and Pennsylvania to the two Dakotas and Minnesota in the Midwest. Without the canal, transporting the grain would require going through the Mississippi and loading it onto ships at New Orleans. From here, the grain would be sent to the east and Europe.

The freight transport aboard the Europe-bound ships also benefited from the steel high pressure compound engines which saved 50% of the coal fuel compared to the iron single cylinder engines. It made a lot of difference as coal used to occupy two thirds of cargo space. By the Third Kondratieff Wave, ships were using fuel oil allowing them to travel farther without refueling while releasing more space for cargo.

Steel has also gone into ship construction. Steel ships are 15% lighter than iron ships, and both do not have the structural limitations of wood which restricts the length of a ship to 300 feet. It thus beggars belief the claims in historical texts that Zheng He's 15th century wooden ships reached 400 feet as the keels of such ships wouldn't have survived the longitudinal stress exerted by the high seas.

Lack of proper transhipment, storage and packing facilities has often resulted in the spoilage of perishable goods. To address this, the steam-powered grain elevator was conceived in the 1840s to mechanise the loading and unloading of grain. For the transport and packaging of meat produce, canning enabled Australia to ship vast quantities of meat to Britain from the 1860s while mechanised refrigerated shipping, introduced in the mid 1870s, did the same for beef and mutton shipped from Australia, Argentina and the US to Britain.

Containerisation which was introduced just before the Fourth Kondratieff Wave helped the US army sort out its logistics mess in the Vietnam war. By packing cargo in standardised boxes, containerisation facilitates the loading and unloading of non-bulk cargo, and its seamless transfers between ships, trucks and trains, very much like the internet formatting and routing data in packets. It has fueled the rise of global trade, the benefits accruing mostly one way from the inefficient and prodigal to the efficient and frugal.

The dramatic increase in cereal yields started to register only from the 1960s although inorganic fertilisers had been available decades earlier proving that it wasn't solely the fertilisers that led to the higher yields. And the increased yields were also recorded for fields fertilised by organic manure (see first chart above). The key to increasing the yields in fact had been found in the Scientific Agricultural Revolution that preceded the Industrial Revolution but it was carried out on livestock, not crops. Only in the 1960s, was cross breeding of plants being carried out to take advantage of the nutrients furnished by the fertilisers. The person most responsible for championing this cause was Norman Borlaug.

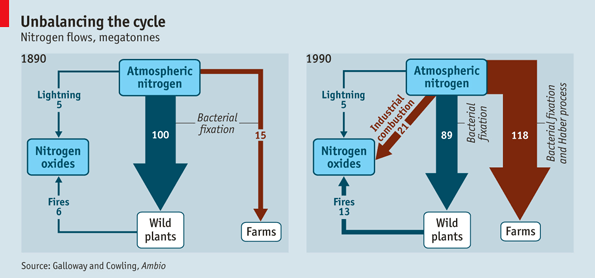
With the artificial synthesis of nitrogen which was invented in 1911 by Fritz Haber, there has been no shortage of inorganic nitrogen-based fertilisers. However before the 1960s, farmers had to restrict fertiliser usage as larger and heavier seed heads would result in the plants toppling over. What Borlaug did with his cross breeding was to produce dwarf wheat breed with shorter stalks that could support the heavy weight of the seed heads. Mass starvation in India was averted with the help of this new breed. The heavy consumption of nitrogen fertiliser on the farms can be seen from the following graphic from The Economist comparing the situations before and after plant cross breeding took hold.


The great transformation of agriculture in the 1960s onwards has conferred us an unprecedented steep increase in population (The Economist chart at left) but this population dividend is now turning into a drag as fertility rates are falling off the cliff. For this, we can thank urbanisation and improved healthcare and yet we'll see more worsening rates with the coming economic depression. Now you know why the great deficits of most nations after World War II could be easily whittled down. The reason can be traced to the global economic expansion on an unparalleled scale brought on by the tremendous increase in population. Simply put, the consumption rose to absorb what the capacity produced. It had never happened before and it will not happen again.

The great availability of nitrogen-based fertilisers doesn't mean that yields would keep improving. Overuse of such fertilisers, as in India, has degraded the soil and lower the yields. India also has its share of other agricultural follies. Although it has recently reported record harvests, there are approximately 250 million Indians who are malnourished. The fault lies with distribution with the poor failing to get their ration coupons. Accentuating the problem is the lack of proper storage facilities, resulting in the high wastage of crops that have been left in the open. The right solution of course is to empower its populace with income generating jobs but that appears very remote as increasing automation and mechanisation have made the poor superfluous. Deaths from hunger have struck not only the urban but also the rural populace, bespeaking the futility of running way from the tightening grips of an economic depression.

As for the world, did the spike in food commodity prices in 2008 (The Economist chart at left) signal the looming shortage of food? Or was it the diversion of corn crop towards biofuel that created the artificial shortage? Although producing bioethanol from corn is indeed a dumb idea to begin with, ascribing the blame of higher food prices to such practice is equally daft. Food commodity-prices slumped in 2009 in line with all commodities despite the fact that there had been no drastic reduction in corn used for biofuel. So the main cause for the spike and decline is money, or rather, credit creation and destruction, as explained in several of my earlier posts.

However based on current agricultural technologies, we certainly have reasons to worry about food shortages. Looking at the first chart above, we know that yields have been static. And the recent issue of The Economist (see chart below) has demonstrated that the recent increase in food production was totally dependent on farming of formerly virgin land in the Amazon and adoption of western agricultural practices in former Eastern Europe Communist land. But these should be the least of our worries if we factor in the emergent technologies that will revolutionise agriculture and food production and distribution in the Fifth Kondratieff Wave.


 Among the radical innovations include genetically modified crops which since their first planting in 1996 have proven to have no ill effects. Since then the area planted with GM crops rose from 1.7 million hectares to 148 million in 2010. Even Craig Venter, who is in the forefront of developing designer bugs and new GM crops, believes that agriculture will undergo a radical change with commodity crops producing 10 to 100 times their current yields. Then we'll see the end of large scale farming as every person starts to grow his own food just enough for his own consumption, no more no less. The need to trade will disappear and with it the government's raison d'etre as food surpluses which were in ancient times the basis for financing the governing bureaucracy start melting away.