Monday, January 7, 2013

The Great Depression's great deception

What was the eventual solution to the Great Depression? Was it Roosevelt's deficit spending programme? Or was it WW2? The right answer is pertinent as the lawmakers of the world's last superpower lurch from crisis to crisis. The events surrounding the Great Depression echo strongly in the current crisis as Obama, like Roosevelt, enters the second term of his presidency with his hands tied. Useful lessons can be drawn by studying closely how Roosevelt almost came to being overwhelmed by the crisis.

Keynesian economists have attributed the recovery from the Great Depression to the massive spending by Roosevelt's New Deal programmes which actually, like Obama's four annual trillion-dollar-plus deficits, didn't lead to any real recovery but merely bought Roosevelt enough time for the mother of all deficit spending, that is, the WW2 military expenditure.

Roosevelt however was more fortunate than Obama as he was in the midst of the Third Kondratieff Wave. The Kondratieff Waves by the way consist of 5 waves. Each of these waves would evolve in the same manner as the ebbs and flows of the Elliott Waves (see left graphic from stockcharts.com). Each of Elliott's green impulse waves corresponds to one Kondratieff Wave. So right up to the Third Wave, the world witnessed the proliferation of nation-states, including the rise of the two biggest superpowers the world has ever known.

The best tool to understanding the plight of any economy is of course the size of its credit market. Below is the usual credit chart of the US economy though this one appears a little bit exaggerated as its peak is shown to have exceeded 400% of GDP (my computation peaks at 385%). Regardless, our main concern is the shape of the credit movement because it enables us to weave a story, and this happens to be the best chart that I've managed to trawl from the web since not only it's the most up-to-date but it also provides a detailed movement by component over the longest time span. For this purpose, I've enlarged the chart so that we can see clearly the revealing details.


The above chart can be deceiving especially in the Great Depression years. On first impression, most people would've thought that the crash was brought about by the credit collapse following the massive increase in credit quantity. Of course, credit did increase compared with the level in 1916 but that was insignificant relative to the level now persisting in the US economy. If you look closely at the years in the above chart, the sharp rise in the debt to GDP % occurred after the 1929 crash, at a time when credit was in fact falling.
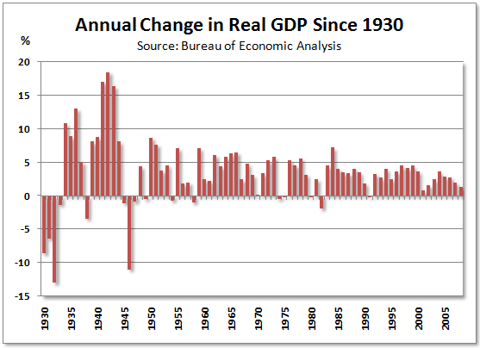
IMAGE What actually unfolded was that the GDP itself was collapsing (see chart at left from Seeking Alpha). The fall in GDP from 1929 to the bottom of the Great Depression in 1933 reached 27% in real terms but because of severe deflation that figure very much understates the drop in current dollars which came to 46%. As the Debt to GDP % is based on current dollars, even if the credit quantity had remained static, the debt to GDP % would've more than doubled. If you compare its level in 1929 with that of 1933, it shows a jump of less than twice, implying that actual credit fell but at a much slower rate than nominal GDP. If the aberration of the Great Depression years is excluded, the normal debt to GDP % for the US economy historically had never exceeded 200% until Ronald Reagan unleashed his massive spending spree.

Now how did Roosevelt engineer the recovery from the Great Depression? Actually he never did but anyway his story makes for an interesting reading. When Roosevelt took up the office of the President in 1933, he suspended gold convertibility, devalued the US$ by 69%, and kickstarted his New Deal programmes. From 1933 to 1937, industrial production went up by 60% and wholesale prices by 31% while unemployment dropped to 14%. But by 1937 Roosevelt wanted to balance the budget while the Fed started thinking of an exit strategy to its quantative easing. Now Obama has similarly expressed the need for a balanced budget. Pretty soon, you'll hear Bernanke broaching the end of his impotent QE.

The reduction in deficit spending in 1937 and 1938 can be seen in the following budget chart (from markmartinezshow.blogspot.com). The effect of the move towards balancing resulted in more imbalancing as the GDP (see preceding chart) fell by 6% (current dollars) or 3% (real dollars) to register a recession in 1938. Effectively Roosevelt's New Deal failed in providing a sustained recovery. Absent the life support of government deficit spending, the economy soon tanked.


As a result Roosevelt had to reverse course in early 1938 but too late to avert another recession. Fortuitously, WW2 erupted in 1939. For the duration of WW2, the heavy deficits of the military spending supported the US economy. Because of the war exigencies, Roosevelt, unlike Obama, had congress on his side. After all no lawmakers wanted to be accused of lacking patriotism in times of war. After the war, the government substantially reduced its spending in 1946, sending the economy into another recession. This proved that the deficit spending, whether on entitlements, infrastructure or military, wasn't the real solution to the Great Depression.

Buoyed by rising incomes and profits following increased factory mechanisation, it was the private sector that took on the task of post-war spending on automobiles, homes and their spin-off stuff which had been suppressed during the war years. Businesses invested in new factories or retooled from military to civilian production. The baby boom that stretched from 1946 to 1963 further fueled the demand for schools, hospitals, suburban homes and roads.

Liberal or Keynesian economists, have exhorted the government to spend in a big way to escape from another looming depression. They have used the example of the massive spending during the Great Depression to support their case. But that example is wrong because the spending under the New Deal and during WW2 only bought time. Furthermore as explained earlier, the steep increase in the Debt to GDP % during the Great Depression was due to a measurement quirk.

In contrast, the debt situation now is  colossal, running at almost quadruple of GDP. The US government is in a much weaker position, more so when the prevailing trend now favours smallness. A superpower is a dying breed, now that the USSR is long gone. There's no compelling reason to maintain another. Keeping a superpower alive is expensive because of the need to feed its voracious appetite. The blue curve in the chart above tracks the nominal amount of the US credit market. The steep increase in debt occurred around the time the USSR splintered. Since then the US economy has been on credit support (see also the Debt to GDP % chart (second chart above)), with more credit needed for every dollar of GDP. But this is no longer sustainable. That's why credit is under severe pressure to come down (see red curve above).

Many US lawmakers are in the erroneous belief that lowering the deficit is good for the economy. Actually it would lead to a recession or more likely a depression but that's the price for the uncontrolled excesses of the past. Much worse is having a bunch of lawmakers that have absolutely no clue on the future direction of the economy.

Wednesday, December 19, 2012

The Marxhall Theory of Economic Growth and Decline

A person's view of the economy is coloured by the economic conditions prevailing during his lifetime. Even the great economic philosophers of the past could not escape the clutches of their economic environments. For that reason, we should always note the years of their births and deaths to establish how their great ideas came about. There are three peculiarities about these philosophers that conditioned their thoughts and philosophy and made them stood out from the crowd. The first is that they were keen observers of human lives and interactions.

The second is that they lived in the days of consumption always exceeding capacity mainly because of ever increasing population growth rate though there were periods, during the economic decline phase, when consumption failed. But a slowing population growth rate or, worse, a declining population was never the contributory factor. So to rely on their ideas for a solution to the current global economic crisis, which has been exacerbated by a falling population growth rate, won't get us anywhere. Theirs were valid only for their times.

As for technology, the progress was already evident in Adam Smith's time. Although the Industrial Revolution was in its early days, the fruits of the Agricultural Revolution, which actually was a precondition for the Industrial Revolution, had been evident. Factory production had also been established though still powered by water — steam powered factory machinery was only made feasible when James Watt produced a rotary-motion steam engine in 1781. Technology therefore was not a differentiating factor between then and now.

Therefore Adam Smith (1723-1790) with his Theory of Absolute Advantage and David Ricardo (1772-1823) with his Theory of Comparative Advantage were strong advocates of free trade. The British economy then was the world's leading economy, so it was to its advantage that trade was free. Also Adam Smith was, first and foremost, a moral philosopher who was more concerned with maximisation of employment rather than profit. As free trade created a bigger market for Britain's produce while enabling its workers to buy cheaper food imports, its benefits were in accord with Smith's stance. Had he lived today, he would have railed against free trade and would have certainly disowned its modern-day champions.

In military-speak, the supporters of free trade are still fighting a second generation war (2GW) in which mass bombardment is the order of the day. Now warfare is in its fourth generation (4GW), characterised by the entry of a large number of non-state combatants. If a nation-state still uses 2GW strategy to fight 4GW opponents, it's a war that the nation-state is condemned to lose, as is unfolding in Afghanistan.

Although capacity was the constraining factor then while now it's consumption, the Nikolai Kondratieff's (1892-1938) cycle of economic growth and decline was equally valid then as now. Kondratieff's argument was that overinvestment (growth phase) led to overcapacity and layoffs which reduced demand (decline phase). In this, he was roughly but not precisely right. Much better was Karl Marx (1818-1883) who was spot on but only in regards to the decline phase.

If the decline phase had been just a case of overcapacity, the climb out of the depths would've been easy because an across-the-board cut in capacity would've restored the pre-decline situation. But what makes a recovery intractable is the extreme imbalance in the suffering. Any supposed solution — deficit spending, tax on the rich, pay cut, inflation — is only a palliative measure because the extreme imbalance won't be redressed. As long as the technology remains as is, whatever money spent goes back to the rich. The only cure comes from technological progress. Joseph Schumpeter (1883-1950) coined a euphemistic term, 'creative destruction', for it. The right term is wealth destruction; old wealth must be destroyed through the introduction of new technologies so that the generation of new wealth could proceed unabated.

However, before even both Kondratieff and Schumpeter identified the technology driven solution to an economic decline, Alfred Marshall (1842-1924) had already cottoned on to this idea. The key difference between Marshall and Marx was that Marshall observed what was going in the factories. Marx never stepped foot into one. What he observed was the conditions in the Manchester slums. Had he done so, we'd have been toasting the Marxist system now.

In the first three Kondratieff waves, every time a technology solution arose, the population was ever ready to grow to absorb the increased production. Now the Fourth Kondratieff wave has again unleashed massive production capacity but this time the constraint to be unclogged is no longer  technology. Instead, it's biology, to be exact, the human fertility rate. Technology cannot solve this. But technology is adapting itself to address this drastically changed paradigm. The Fifth Kondratieff wave is ushering in technologies that provide pinpoint answers to human needs. Need a component? Worry not, a 3D printer will print it, one unit only, no more no less, on the spot. Need chemotherapy? Instead of chemotherapy, molecular target therapy can precisely target the cancerous tissue without affecting others surrounding it.

Finally, the last common factor that bind these philosophers together is that they never substituted mathematics for their keen observations unlike the current generation of economists who put mathematics at the forefront of their thought process, akin to putting the cart before the horse. No wonder no great economic ideas have of late percolated from their blinkered minds. To be sure, some of the great philosophers did resort to mathematical rigours to test their ideas but mathematics was always kept in the background. Here's how, as written in Wikipedia, Alfred Marshall described his use of mathematics to support his economic ideas:
  1. Use mathematics as shorthand language, rather than as an engine of enquiry.
  2. Keep to them till you have done.
  3. Translate into English.
  4. Then illustrate by examples that are important in real life.
  5. Burn the mathematics.
  6. If you can't succeed in (4), burn (3). This I do often.
As Marshall was Keynes's economics teacher, now we know why Keynes eschewed mathematics in his economics writings though he might have resorted to mathematics in conceptualising his ideas.

We can do one better than Marshall. Instead of using mathematics, we can resort to the plethora of patterns in the real world to illustrate the mechanics of an economic wave. For example, its 4C underpinning is based on an observation of product movements on the factory shop floor while the skewing of wealth towards the end of an economic wave is gleaned from the Monopoly board game.

Regardless, Marx and Marshall deserve the the credit for being the first to get it right, albeit each getting half right, in describing the growth and decline of an economic wave. Marx also has the last word, if not the last laugh at seeing the eventual collapse of capitalism, since he was the one who coined the label 'capitalism'.

Tuesday, December 11, 2012

Seize money before money seizes up

We've been used to the notion that money was essentially credit. But after observing how credit moved over the past few months, our usual definition of money now stands corrected. Money now should be defined as spent credit or moneyspend. The reasoning is very simple. You can have $1 trillion dollars but if you sit on it, that money doesn't affect the economy one whit. It's dead money. It must be spent to qualify as real money.

Paul Krugman, always lost in the trees because of too much thinking about the forest, has recently come out with another of his naive statements: "Remember, the US government can't run out of cash (it prints the stuff)." Now if you consider moneyspend as the real money, you can see why Krugman's talking with his sleep mask on. Surely, the US government can't run out of cold hard cash (dead money) but it has limits on how much it can spend (real money).

Another more confused person, Ben Bernanke, is pushing the Fed's holdings of Treasury bonds and Mortgage Backed Securities (MBS) to US$4 trillion from the current US$2.86 trillion. In return he'd be dishing out more deposits to banks and other financial institutions. We've been through this before and we know where this would lead to. Ben mistakenly believes that deposits (another dead money) can be conjured into spending (real money).

There's another money conjuring trick carried out lately by non-financial business corporations. We know that equities are also money but they are safe money because their value move in tandem with the credit quantity. So there's no point in monitoring them. Debts in contrast are toxic money, that is, when economic conditions deteriorate. In current conditions, you must get rid of debts by all means regardless of how cheap they can be. But because of Ben Bernanke's manipulation of the interest rates, the business corporations have been lured by the siren song of cheap interest rates to raise bonds in order to buy back equities.

Bond interest costs are now dirt cheap (see chart at left) while equity returns are expensive. In swapping equities for bonds, the business corporations are pushing equity prices higher despite the gloomy earnings forecasts. But the financial risk of bonds increases as the depression looms nearer. If you're thinking of putting your money into equities or corporate bonds, don't. No matter how profitable a business is right now, its income will plummet with the collapsing credit. Only the rare few will continue registering profits. CEOs will soon realise that the external environment will overwhelm them regardless of their business savvy.

Even now an increasing proportion of investment-grade new bond issues are those with credit ratings at the low end of the investment grade (see charts below).


The business corporations' switch to bonds for their funding has been received with open arms by the investment funds who lap up the corporate bonds in the erroneous belief of their low risk (see charts at left). Actually the better bet is the government bonds of the strong national economies, such as the US and Germany but their available supply is getting less and less as central banks mop them up through their quantitative easing. Furthermore, the austerity drives undertaken by many governments limit the supply of new government bonds.

Equally troubling is the dubious safety of the MBS purchased by the Fed. Of its US$1 trillion new quantitative easing, US$620 billion will be for MBS and US$500 billion for Treasuries. As house prices are expected to begin their decline soon, the MBS is as safe as the flimsy guarantees of Fannie Mae and Freddie Mac. To put it simply, the US government will need to widen its deficits in the near future to rescue both institutions so as not to drag the Fed down with them.

Bernanke's cheap money for the time being is creating an illusion of an economy on the mend by shoring up the stock indices but in the final analysis is deferring massive problems to the future. The stress has not been relieved but continues to build up and when it finally bursts, Bernanke's effort will be laid bare as a hopeless patch-up job.

The futility of this effort can be  viewed in the Q3 2012 US total credit picture (left chart), in which the businesses appeared to have increased their credit growth. Under normal conditions, this would be favourable to the economy. But as explained earlier, the increase in credit was offset by a decrease in equities. So there was no impact to spending. If we exclude this growth, there was no credit growth by all sectors except that contributed by the US federal government. Extending this trend ahead, the credit outlook for Q4 2012 and for future years would appear bleak indeed.

As a percentage of GDP (left chart), the picture is worse still. Even the government debt is flagging. indicating that we have reached a turning point.

The 0.2% improvement in the latest unemployment rate is meaningless as the labour force participation rate in the same survey shows a retrogression of a similar percentage, down from 63.8% to 63.6%.

With the slow but relentless fall in credit quantity, money will be hard to come by. For the immediate term, the most secure investment is the US treasuries but over the medium term, real physical cash is king. There's no risk of loss in value. For the long-term, that is 50 years from now, only precious metals serve as the only means of wealth accumulation as nation-states start crumbling and national paper money will disappear along with its issuing nations. However an economy is not about wealth accumulation, rather it is more about wealth generation and consumption and in this sense, locally issued paper money serving the local community and circulating only within it would ensure that wealth gets produced and consumed within that self-contained community.

Friday, November 30, 2012

The farcical cliff

Ben Bernanke seems to have a way with coining terms that can leave everybody in utter confusion. First, it's quantitative easing and now it's fiscal cliff. As the fiscal cliff looms ahead, we are being led to believe that failure to overcome the cliff will land us in recession. The cliffhanger is the showdown between the Democrats and Republicans. Both have different views on how the fiscal cliff should be handled. To reduce the deficits, the Republicans want to cut entitlement spending while the Democrats want to increase taxes. However these are all distractions serving to demonstrate that the politicians' primary job is to spin no-brainer issues into newsworthy material.

It's easy to figure out the Western thought process because it tends to be binary: either black or white, always insisting upon a solution and with little tolerance for grey areas. Since both parties are adamant that they're on the right track, both will not budge from their entrenched positions, more so when one side is still smarting from the recent election defeat.

Even without this fiscal cliff, Obama's ability to throw money at the economic problems will be severely crimped given that his administration's $1 trillion odd deficits in each of the last 4 years have not yielded any long-lasting recovery. That isn't surprising considering that we're in the second half of the Fourth Kondratieff Wave.

If you are presented with this situation, how should you approach it? To tackle this seemingly tough problem, you need a pattern as a guide. For this there is no better pattern than the Monopoly board game. The other thing that we need to know is where we are in the Kondratieff Wave cycle. There are 2 actually, the uptrend first half and the downtrend second half. With just these, you can foretell, like no economist can, how events will unfold.

The first half of the wave is when you start playing the Monopoly game. This is the most exciting part because everybody is eager to grab properties. So when the banker pours money into the game, it will keep circulating in the game as assets are being purchased and sold. But when you reach the second half, the excitement starts dwindling down. There are no more properties up for grabs. If you're losing, you'd rather be in jail since every move you make costs money. Any money poured by the banker will end up with the sole winner.

What has this got to do with our present predicament? Almost everything, in fact. All the current economic difficulties can be easily explained by the Monopoly game. So any deficit spending now will ultimately end up with the few winners. As the government will eventually be weakened by continual deficits, it must start getting the money from the winners, the rich, that is, to fund its spending. But the rich with their footloose wealth can run rings around the taxman. Ask Mitt Romney how. One is to park their financial wealth in offshore tax havens with ultra low tax rates. The other is to recast their incomes as capital gains which also attract a much lower tax rate. As long as capital controls are absent and tax law is riddled with loopholes, the ability of political leaders to control the national economy and by extension the national politics is tenuous.

What about the Republicans' proposal to cut entitlement spending while maintaining the current tax rates? Without increased spending, the economy will quickly go into a tailspin. The Republicans' contention is that the lower tax rates will encourage the rich to invest and create jobs. That's a load of bull. Again we seek the help of our Monopoly pattern. When the game has settled down to a predictable pattern, the winner will just collect rentals. He has no need to build new hotels. After all, with the present investment, he's already winning. The proof is in the statistics. Another of the various income imbalance charts that I've been plugging just to highlight the real cause of the depression is shown above (this one from The Financial Times).

If the government doesn't wrest the wealth from the rich, there's no new spending to perk up the economy. The rich fail to grasp that whatever spending the government makes, be it on entitlement, military or whatever, will ultimately end up in their bank accounts. So it is in their interest to pay more tax. They can play the Monopoly game much longer, and keep winning while at it.

Both groups of politicians can't comprehend this simple concept. As a result, they both agree that the deficits have to be reduced. For comparison, the 2012 US Federal deficit was estimated at US$1,089 billion. The fiscal cliff, if not addressed, will reduce the deficits by US$535 billion. The fiscal cliff is not the issue. The real issue is the amount of the deficits. The amount that they can agree will be substantially less than US$1 trillion. So fiscal cliff or not, it's highly conceivable that the US economy will slump in 2013.

Recriminations between the two parties will intensify with the worsening state of the economy, causing them to dig their heels deeper. One will insist that entitlement spending discourages people from working while the other will claim that reduced taxes do not trickle to the economy at large. This is an exercise in futility as the solution is not to be found in the Fourth Kondratieff Wave. Future economic growth has been forecast to be anaemic, meaning that the economy cannot outgrow the debt. To artificially boost growth, the economy really needs bigger spending but there's no longer any economic sector that can bear ever increasing spending. All have been squeezed dry, that is, except the rich.

As an aside, I can't help taking a dig at the housing bulls, especially The Financial Times which came up with the following headline in its 28 November 2012 issue: "US growth hopes lifted by housing data", just after the Case-Shiller index for September 2012 had been published. Now I've updated it in my own chart above. As you can see, the pattern of housing price increase still remains. But the increase was very marginal in September 2012 and if you project it to the next month, prices will start dropping. If an eminent financial newspaper can betray its economic ignorance with such a premature headline, what can you expect of economic pundits and talking heads who are much less endowed in their cognitive faculties?

Friday, November 16, 2012

Consumptivity, not productivity

Economic growth worldwide is on a decline. Economists have been attributing this to the declining productivity which itself is a reflection of the much reduced impact of the new economy's technological advancement as compared to that of the earlier technology waves. Robert J. Gordon, an economics professor from Northwestern University, has produced a paper tracing the economic growth since 1300 (the two charts on the left below, reproduced by The Financial Times) as well as evidence of the declining US productivity (the two charts on the right).


This is typical of an economics professor pontificating from on high. There's actually nothing wrong with the rate of technological progress.  We know that productivity is the ratio of output to input. Economists can't explain why output declines or increases for the same level of input. To them, the link between input and output is a black box. But implicit in that link is the little known assumption that whatever can be produced will be consumed.

If only the economists had worked in a manufacturing setup, they would learn that a factory's main problem was not producing but selling. No production planner would produce goods that cannot be sold. He may produce for inventory but that can only be sustained up to a certain level, determined by the availability of his cash or credit. Beyond that, it's economic suicide.

If you come across anything inscrutable as the economist's productivity black box, the right way to address the issue is not to ignore it but to view it from another angle. The fact that the black box is termed 'productivity' is itself a cause of the confusion. Because of that, production output has always been the sole measure. Whether the factors of production are not producing because of something else doesn't count. Since we know that for a manufacturing setup, getting the goods out the door to the consumers is the main challenge, consumption is thus a better measure than production. Now if we instead label the black box 'consumptivity', then a whole new vista opens up. The problem is no longer solely production but extends to consumption.

But how do we prove that the problem lies with consumption? In this regard, we can rely on two plausible explanations. One is population growth and the other is falling income as a result of technological progress and globalisation. We can show two population charts, the movements of which mirror those of the two leftmost charts above.

The first is the rate of population growth (left chart from Wikipedia). The shape is similar to that of the GDP growth rate. Even though the GDP growth chart tracks the growth of the UK GDP (for the First Kondratieff Wave) and the US GDP (for subsequent Kondratieff Waves), the impact of that growth has trickled to the whole world as reflected in the global population growth rate.

If you observe this population chart carefully, you'll notice two kinks. The first, between 1900 and 1950, is the result of the two major wars in which more than 16 million and 60 million deaths were recorded for WW1 and WW2. The second reveals the folly of China's Great Leap Forward, which lasted from 1958 to 1961. Upwards of 30 million lives were believed to have perished by famine. However these kinks did not alter the secular trend of the pattern. It goes to show that long-term trend can be easily foretold years in advance. Even now, we can foresee the future outlook of economic growth just by looking at the population growth rate. Neither sixth sense nor fancy forecasting tool is needed. Also with patterns, we won't be blindsided by any black swan, which anyway is a lame excuse offered by those who fail to recognise obvious patterns.

The next chart maps the global population since 0 CE (Common Era). It corresponds to the GDP per capita chart above, that is, the second chart from the left. Even if you use total GDP instead of per capita, the same pattern would appear as the populations of the UK and the US have always been on the rise. These two charts are strong enough proofs of the close link between economic growth and population growth. It's not just a case of one causing the other; it's more of  a mutually reinforcing relationship. But now the population growth is starting to give in as a result of lower fertility rates; the opportunity cost of raising a kid is a main contributing factor.

Next we need to explain the productivity behaviour in the two right panels of the top charts. For this we have to rely on our 4C. The first C of this Fourth Kondratieff Wave, that is, the capacity driver  is the computer. It's fitting therefore to label this wave as the Intellectual Revolution. But on its own, it cannot power economic growth in a big way.

We thus need the second C, the internet, to act as the communication driver. We all know that the internet started becoming common in the mid-1990s. That's when the productivity measure began to improve. But how was this improvement possible when the population growth rate for the US and the whole world was slowing? To counter this headwind, we need the third C, the currency as represented by the debt increase. Notice that the first wave of debt increase on the left chart was initiated by President Reagan through government borrowings but the second wave was kicked off by President Clinton through private sector debt, both towards the end of their first terms in 1983 and 1995 — that's how both got reelected. However the impact of this debt increase on productivity could last until 2004 as productivity began declining from 2004 onwards, as indicated by the second panel from the right of the top charts above.

The technological  improvements of this Kondratieff Wave turn out to be more vicious than virtuous. Now we don't need as many workers as before. Work that used to require simple logical decisions by the workers can now be handled by microprocessor powered sensors, remotely controlled using SCADA systems. At most, only one person is needed to supervise the running of the SCADA system. For work requiring an army of workers, outsourcing and globalisation have sent the jobs to other corners of the world.

Productivity has actually tremendously increased, if only all the potential output can be consumed. But this was not happening as from 2001 to 2004, the labour force participation rate (left chart from the BLS) started declining. This pattern continues to this day.

Business corporations are caught in this vicious circle of lower consumption yielding lower income which again leads to lower consumption as workers spend less and less. The productivity slackens as workers remain on the payroll but not producing to their full extent because there are limited takers for their output. To improve productivity, the corporations retrench more workers which further worsens their buying power. Those still working end up in the low paying and low productivity service sector.

Such is the fate of mankind. In its quest for progress, it finds the answer but one that puts itself in a state worse off than before.