The new Japanese prime minister must be feeling smug now that the Nikkei index has jumped by leaps and bounds at a time when other stock indices are sluggish. Has Shinzo Abe at last discovered the solution to the deflationary crisis which has plagued the nation since 1990? It's still early days. But Prime Minister Abe has delivered nothing other than bluff and bluster. Reality has to yet to sink in but if past precedents — the most famous being Reaganomics and Thatchernomics — of such word blending are any guide, then the Japanese people have been promised nothing but snake oil.
The Japanese economy is in the doldrums for more than 20 years that any glimmer of hope is quickly seized upon lest it soon vanishes. Abe is taking the deflation bull by its horns when he promises to end deflation through massive deficit spending, money printing and deregulation. Many economists have applauded him for taking such a stance, in the hope that his success will prod the EU leaders to end their austerity programme.
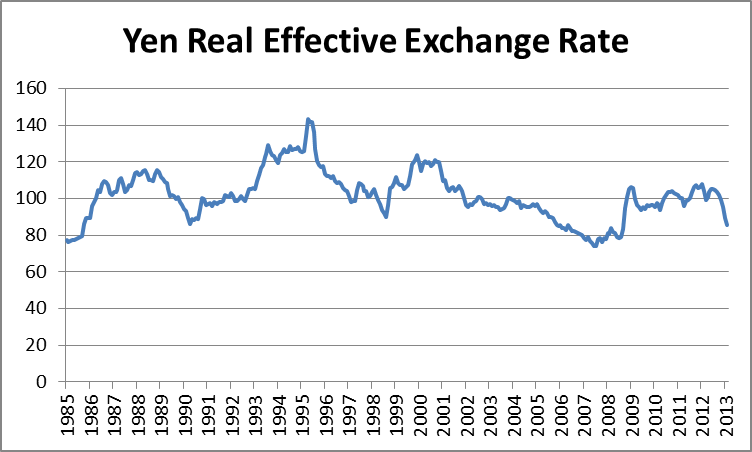
Abe's immediate apparent success as reflected in a 20% drop in the yen exchange rate and a 40% rise in the Nikkei index since assuming the premiership has given credence to his mission of trumping deflation. Abe is salivating at this prospect but reality will disappoint him. Abe was once an average prime minister who stepped down voluntarily. So why should he be different this time around? Of course he can avoid the musical-chair fate of his predecessors if he continues to strike a hardened attitude towards his similarly economically troubled neighbours over the disputed islands as a diversion from economic issues.
We can pick holes in Abe's deflationary busting strategy but we will start by setting the record straight on the large fall in the yen exchange rate. Exchange rates are a puzzle to many simple because they're unpredictable. However ignoring the short-term fluctuations which are the outcome of speculative manipulations, exchange rates move in line with a country's current account balance. If a country's current account is increasingly in deficit, its exchange rates will soon drop unless that the deficit is sustained on increased foreign debt. Even then, in the long run its exchange rate will plunge if the current account remains persistently negative. The only exception is the US as it still is an economic and military superpower.
The Japanese current account balance generally has always been positive (The Economist chart at left). Not shown on the chart are the CA deficits in January 2012 and from November 2012 to January 2013. The deficits were a result of the strong yen. It is therefore natural for the yen to devalue in order to restore the CA balance. In fact in February 2013, the CA account was back to surplus. So we can expect the yen to stabilise in the coming months. Any further devalution can be attributed to speculators expecting to make some quick gain.
If we compare the above chart with the yen real effective exchange rate (left chart compiled from the Bank for International Settlements' data) we can discern two inversely opposed movements. Note that an upward movement on the REER chart denotes an appreciating yen. The contrast may not be exact, at times with lags of 1 or 2 years, but generally the two charts complement one another in their contradiction. So despite what Abe has asserted, the yen exchange rate is outside his control. It was a mere coincidence that his tenure started with a drop in the yen value.
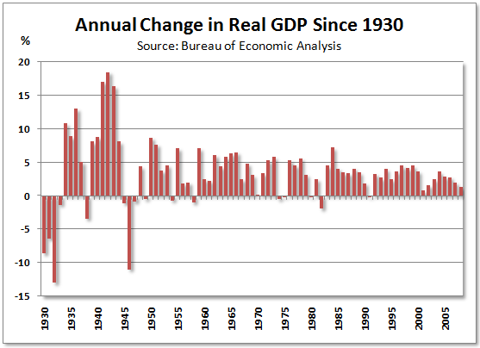
The next question is can Abe engineer a continuing drop in the yen exchange rate and in the process reverse the Japanese deflationary environment? The Bank of Japan is committed to "printing" $1.43 trillion worth of yen. A comparison has been made to the situation that prevailed in 1920s Japan when Japan was under the spectre of severe deflation. A new government assumed office in 1931 and Korekiyo Takahashi was installed as the finance minister. He undertook three steps: depreciated the yen by 50%, cut the official discount rate by 3%, and increased government spending by 5% of GDP. The spending was financed through money printing. The economy recovered but Takahashi was assasinated in 1936 when he tried to rein in military spending because like what Roosevelt went through, both governments had limits on deficit spending. Only WWII saved both governments from hurtling back into depression.
To find out whether a similar prescription would be successful in the current crisis, we will revert to our usual patterns for guidance. We will rely on the 4C framework as well as the economic trilemma in which a country's leader can choose only two options out of three, to wit, a fixed exchange rate, an open capital market and an independent monetary policy. Takahashi chose the first and the last. He imposed capital controls on currency movements. Shinzo Abe and Haruhiko Kuroda, the new BOJ governor, have not chosen any two. They will probably stick with the status quo, thus ensuring that their fate will be at the beck and call of economics.
As for the 4C, the two critical components are capacity and consumption. In respect of capacity, the whole world is suffering from severe excess. But for consumption, it's a case of too little. The chart below from dalmady.blogspot.com shows that in the 1930s, Japan was still experiencing growing consumption from a burgeoning population. But its population peaked in 2005 and has been both declining and growing older ever since. This chronic excess capacity and low consumption means that Japan, and soon many others, cannot avoid the deflation trap. Unlike other variables, you can't reverse population trend on a dime; even now you can predict what'll unfold 50 years hence.
We also can make an educated guess on the impact of Abe's massive spending and money printing. Abe's massive spending, not money printing, mind you, will create money which will circulate in the economy. As Japan has massive capacity, most of the money will most likely go to the local winners of the economic game (remember our Monopoly board game). They will surely not consume the money but invest it in real estate or foreign bonds — though it is arguable whether this is possible when other countries are reducing their CA deficits. The same scenario is unfolding in the US. What Japan will end up with is a real estate bubble or a massive holding of foreign bonds. Inflation if any will be very low. This wealth will be wiped out once the bubble bursts which it will because the assets will not generate any income when wealth remains stuck with the winners.
As for deregulation, the third leg of Abe's planned reform, it'll make wealth accumulation more lop-sided. In deflation, you don't need the economy to be more efficient through free trade and deregulation. Instead you must make it more inefficient, the purpose being to give the losers more opportunity of earning income. It sounds ridiculous but if you take a leaf out of ecology, you'll find that only with isolated niches can species proliferate (see Worry not global warming but fear globalisation).
The only way for Abe to generate high inflation is if the country's capacity is wrecked so that more money through massive deficit spending is not matched by increased goods output, as experienced by Zimbabwe under Robert Mugabe. The yen exchange rate will plunge and nobody would want to touch the yen. But on the positive side, Japan's humongous debt which in 2012 was 233% of GDP will be wiped out. Japan can then rebuild its economy based on the new technology of the Fifth Kondratieff Wave. This is only wishful thinking because absent a major destructive war, such a scenario is unlikely to happen.
More than just prognosticating on the future of Japan, what I'm trying to illustrate with this post is the power of using pattern recognition rather than shallow analytical thinking which is characteristic of the assumptions used in many economic models. I've read through many articles of brilliant economists on Abenomics and they all came to the same conclusion, that is, the yen would significantly depreciate and Japan's economy would thrive. What damage have the mathematical models done to their brains? To prove that mathematics matters little in developing ideas, you should read this interesting Wall Street Journal op-ed piece by E.O. Wilson, the famous biologist.
With so much confusion in economics and politics, it's high time that we step back and view events from a new perspective - the perspective of pattern recognition. Recognitia derived from recognition and ia (land), signifies an environment in which pattern recognition prevails in the parsing of events and issues, and in the prognostication of future outlook.
Monday, April 8, 2013
Wednesday, March 20, 2013
The reality behind realty
Now we know the truth behind the rise in home prices. Bloomberg has just come out with the story on the continued rise in US home prices. It's the same group of people blowing bubbles both in the stock markets and in the real estate markets. Although it appears that Bernanke is feeding the frenzy with his continued $85 billion dollars of monthly QE, his QE actually is not leading to new net lending by Fannie Mac or Freddie Mac. It's the investment firms that are moving money from other asset classes into home investment. As the winners shift money, the losers wonder bewilderingly why, as they get hammered by unemployment, their former homes are rising in value.

The above chart taken from the same Bloomberg article which shows new purchase mortgages up to the 3rd quarter of 2012, does not jibe with the rising money pouring into real estate. That's because the massive money is coming from the big investors who are hoarding homes for future speculation.
To further corroborate the disconnect between the two worlds of speculation and real ownership, the above chart from the AEI website shows that homeownership rate has been free-falling from a high of 69.4% in the 2nd quarter of 2004 to a low of 65.3% in the 3rd quarter of 2012. The latest reading for the 4th quarter of 2012 is still stuck at 65.3%. This level was last registered in the 1st quarter of 1996. If the rising home prices do not match reality on the ground, the only eventual outcome is a nasty implosion. As usual, the biggest losers would be the individual buyers who are always late into the game. They'd be caught napping with their pricey mortgages tagged to fast eroding home value.

The above chart taken from the same Bloomberg article which shows new purchase mortgages up to the 3rd quarter of 2012, does not jibe with the rising money pouring into real estate. That's because the massive money is coming from the big investors who are hoarding homes for future speculation.
Saturday, March 16, 2013
Times of disconnect

During the 1930s Great Depression, there were 7 rallies from the 1929 peak to the bottom stretching over a period of 3 years. Each rally produced a peak that was lower than the preceding one. But this time, it's different. The new peak is higher than the old peak. However if you dig deep into the causes, you'll realise that the playbook is the same. Misleading metrics have been put up to give an impression of an economic recovery. Given the right metrics, it'll soon be obvious that the pattern hasn't changed, only that the movement has been exaggerated because of Obama's deficits and Bernanke's QE that have topped trillions of dollars.
The future is portending worse conditions. On the surface, however, things have brightened up: stocks, home prices and payroll number are all up. The bullish talking heads are back to rationalising why markets are going to breach new highs. A co-author of Dow 36,000 has come out of hiding to unabashedly declare that his prediction would be borne out in due course. Remember that the book was published in 1999, before the dotcom bubble. It's no coincidence that stock market crashes tend to follow preposterous claims of suchlike.
Our three trusted charts — the total credit, the home price index and the labour force participation rate — can adequately explain the goings-on in the economy.
Our first series of charts pertain to the total credit or debt of the US economy. We begin with the absolute amount of the components of the total debt. Here we can see that the main driver of credit and, by extension, the economic growth of the US economy is government spending. This has been followed lately by businesses though this is the result of them being the ultimate beneficiary of the government largesse. Don't rely on the GDP component growth chart which always ascribes GDP growth to personal consumption. Personal consumption is the last in the spending chain. Consumers spend if they have stable incomes from government and businesses. The drivers of that spending have to be government or businesses. Although some of Obama's spending has gone towards social programmes, the money eventually flows to businesses. As a result, they're sitting on a cash mountain while raising junk bonds that bypass the banking system. No wonder the banks are continuing their shrivelling act.
But aren't the rising stock prices justified by the improving profits of the US corporations? Remember our monopoly board game. The sole winner will continue winning as long as others, which in the real world means the US government, continues spending. But the stock indices capture only the performance of the small number of winners, not the majority who are on the losing side. With the sequestration in effect, future credit growth will be stymied and so will GDP growth and corporate profits.
Next are the series of home price index charts. Newspapers and other publications have been publicising the continued rise of the US home prices as observed on the left chart. Bernanke must also be relishing at the sight of this. But this chart is deceptive. If you ask any asset manager on his investment performance, he'd choose a convenient reference point that will portray his performance in a good light.
We can similarly present the same using a different reference point, not one but two. First is the home price index since the start of the decline in July 2006. A different picture now emerges. The index is struggling to rise. It should have been falling but the recent uptick in credit has been artificially propping it up. The next few months will provide a clear direction on its true movement.
The second reliable home index chart tracks its monthly change. Here you can see the index moving up. But this movement is still indecisive. It's only a slight uptick which can be confirmed if it continues over the next 3 months. Bear in mind that in each of the last 4 years, Obama had a trillion dollar deficit firepower. This year it is being neutralised. Can home prices continue their upward move without the help of federal deficit?
Our final true indicator, the labour force participation rate, needs no chart. You can view it at the Bureau of Labor Statistics website. The US unemployment rate has just registered a record four-year low at 7.7%. That's nothing compared to the LFPR which is at a record 31-year low at 63.5%. Actually, the number was reached in August 2012. It improved slightly over the last few months but now has fallen back. Again the next few months will confirm the direction in which the employment market is heading to.
So with metrics, be very wary of what is being presented. In the business world, everyone is well versed at gaming the numbers. So it is in economics. If you're investing, generate your own metrics as things portrayed by the media are not what they seem.
Monday, January 7, 2013
The Great Depression's great deception
What was the eventual solution to the Great Depression? Was it Roosevelt's deficit spending programme? Or was it WW2? The right answer is pertinent as the lawmakers of the world's last superpower lurch from crisis to crisis. The events surrounding the Great Depression echo strongly in the current crisis as Obama, like Roosevelt, enters the second term of his presidency with his hands tied. Useful lessons can be drawn by studying closely how Roosevelt almost came to being overwhelmed by the crisis.
Keynesian economists have attributed the recovery from the Great Depression to the massive spending by Roosevelt's New Deal programmes which actually, like Obama's four annual trillion-dollar-plus deficits, didn't lead to any real recovery but merely bought Roosevelt enough time for the mother of all deficit spending, that is, the WW2 military expenditure.
Roosevelt however was more fortunate than Obama as he was in the midst of the Third Kondratieff Wave. The Kondratieff Waves by the way consist of 5 waves. Each of these waves would evolve in the same manner as the ebbs and flows of the Elliott Waves (see left graphic from stockcharts.com). Each of Elliott's green impulse waves corresponds to one Kondratieff Wave. So right up to the Third Wave, the world witnessed the proliferation of nation-states, including the rise of the two biggest superpowers the world has ever known.
The best tool to understanding the plight of any economy is of course the size of its credit market. Below is the usual credit chart of the US economy though this one appears a little bit exaggerated as its peak is shown to have exceeded 400% of GDP (my computation peaks at 385%). Regardless, our main concern is the shape of the credit movement because it enables us to weave a story, and this happens to be the best chart that I've managed to trawl from the web since not only it's the most up-to-date but it also provides a detailed movement by component over the longest time span. For this purpose, I've enlarged the chart so that we can see clearly the revealing details.
The above chart can be deceiving especially in the Great Depression years. On first impression, most people would've thought that the crash was brought about by the credit collapse following the massive increase in credit quantity. Of course, credit did increase compared with the level in 1916 but that was insignificant relative to the level now persisting in the US economy. If you look closely at the years in the above chart, the sharp rise in the debt to GDP % occurred after the 1929 crash, at a time when credit was in fact falling.
What actually unfolded was that the GDP itself was collapsing (see chart at left from Seeking Alpha). The fall in GDP from 1929 to the bottom of the Great Depression in 1933 reached 27% in real terms but because of severe deflation that figure very much understates the drop in current dollars which came to 46%. As the Debt to GDP % is based on current dollars, even if the credit quantity had remained static, the debt to GDP % would've more than doubled. If you compare its level in 1929 with that of 1933, it shows a jump of less than twice, implying that actual credit fell but at a much slower rate than nominal GDP. If the aberration of the Great Depression years is excluded, the normal debt to GDP % for the US economy historically had never exceeded 200% until Ronald Reagan unleashed his massive spending spree.
Now how did Roosevelt engineer the recovery from the Great Depression? Actually he never did but anyway his story makes for an interesting reading. When Roosevelt took up the office of the President in 1933, he suspended gold convertibility, devalued the US$ by 69%, and kickstarted his New Deal programmes. From 1933 to 1937, industrial production went up by 60% and wholesale prices by 31% while unemployment dropped to 14%. But by 1937 Roosevelt wanted to balance the budget while the Fed started thinking of an exit strategy to its quantative easing. Now Obama has similarly expressed the need for a balanced budget. Pretty soon, you'll hear Bernanke broaching the end of his impotent QE.
The reduction in deficit spending in 1937 and 1938 can be seen in the following budget chart (from markmartinezshow.blogspot.com). The effect of the move towards balancing resulted in more imbalancing as the GDP (see preceding chart) fell by 6% (current dollars) or 3% (real dollars) to register a recession in 1938. Effectively Roosevelt's New Deal failed in providing a sustained recovery. Absent the life support of government deficit spending, the economy soon tanked.

As a result Roosevelt had to reverse course in early 1938 but too late to avert another recession. Fortuitously, WW2 erupted in 1939. For the duration of WW2, the heavy deficits of the military spending supported the US economy. Because of the war exigencies, Roosevelt, unlike Obama, had congress on his side. After all no lawmakers wanted to be accused of lacking patriotism in times of war. After the war, the government substantially reduced its spending in 1946, sending the economy into another recession. This proved that the deficit spending, whether on entitlements, infrastructure or military, wasn't the real solution to the Great Depression.
Buoyed by rising incomes and profits following increased factory mechanisation, it was the private sector that took on the task of post-war spending on automobiles, homes and their spin-off stuff which had been suppressed during the war years. Businesses invested in new factories or retooled from military to civilian production. The baby boom that stretched from 1946 to 1963 further fueled the demand for schools, hospitals, suburban homes and roads.
Liberal or Keynesian economists, have exhorted the government to spend in a big way to escape from another looming depression. They have used the example of the massive spending during the Great Depression to support their case. But that example is wrong because the spending under the New Deal and during WW2 only bought time. Furthermore as explained earlier, the steep increase in the Debt to GDP % during the Great Depression was due to a measurement quirk.
In contrast, the debt situation now is colossal, running at almost quadruple of GDP. The US government is in a much weaker position, more so when the prevailing trend now favours smallness. A superpower is a dying breed, now that the USSR is long gone. There's no compelling reason to maintain another. Keeping a superpower alive is expensive because of the need to feed its voracious appetite. The blue curve in the chart above tracks the nominal amount of the US credit market. The steep increase in debt occurred around the time the USSR splintered. Since then the US economy has been on credit support (see also the Debt to GDP % chart (second chart above)), with more credit needed for every dollar of GDP. But this is no longer sustainable. That's why credit is under severe pressure to come down (see red curve above).
Many US lawmakers are in the erroneous belief that lowering the deficit is good for the economy. Actually it would lead to a recession or more likely a depression but that's the price for the uncontrolled excesses of the past. Much worse is having a bunch of lawmakers that have absolutely no clue on the future direction of the economy.
Keynesian economists have attributed the recovery from the Great Depression to the massive spending by Roosevelt's New Deal programmes which actually, like Obama's four annual trillion-dollar-plus deficits, didn't lead to any real recovery but merely bought Roosevelt enough time for the mother of all deficit spending, that is, the WW2 military expenditure.
Roosevelt however was more fortunate than Obama as he was in the midst of the Third Kondratieff Wave. The Kondratieff Waves by the way consist of 5 waves. Each of these waves would evolve in the same manner as the ebbs and flows of the Elliott Waves (see left graphic from stockcharts.com). Each of Elliott's green impulse waves corresponds to one Kondratieff Wave. So right up to the Third Wave, the world witnessed the proliferation of nation-states, including the rise of the two biggest superpowers the world has ever known.
The best tool to understanding the plight of any economy is of course the size of its credit market. Below is the usual credit chart of the US economy though this one appears a little bit exaggerated as its peak is shown to have exceeded 400% of GDP (my computation peaks at 385%). Regardless, our main concern is the shape of the credit movement because it enables us to weave a story, and this happens to be the best chart that I've managed to trawl from the web since not only it's the most up-to-date but it also provides a detailed movement by component over the longest time span. For this purpose, I've enlarged the chart so that we can see clearly the revealing details.
The above chart can be deceiving especially in the Great Depression years. On first impression, most people would've thought that the crash was brought about by the credit collapse following the massive increase in credit quantity. Of course, credit did increase compared with the level in 1916 but that was insignificant relative to the level now persisting in the US economy. If you look closely at the years in the above chart, the sharp rise in the debt to GDP % occurred after the 1929 crash, at a time when credit was in fact falling.

Now how did Roosevelt engineer the recovery from the Great Depression? Actually he never did but anyway his story makes for an interesting reading. When Roosevelt took up the office of the President in 1933, he suspended gold convertibility, devalued the US$ by 69%, and kickstarted his New Deal programmes. From 1933 to 1937, industrial production went up by 60% and wholesale prices by 31% while unemployment dropped to 14%. But by 1937 Roosevelt wanted to balance the budget while the Fed started thinking of an exit strategy to its quantative easing. Now Obama has similarly expressed the need for a balanced budget. Pretty soon, you'll hear Bernanke broaching the end of his impotent QE.
The reduction in deficit spending in 1937 and 1938 can be seen in the following budget chart (from markmartinezshow.blogspot.com). The effect of the move towards balancing resulted in more imbalancing as the GDP (see preceding chart) fell by 6% (current dollars) or 3% (real dollars) to register a recession in 1938. Effectively Roosevelt's New Deal failed in providing a sustained recovery. Absent the life support of government deficit spending, the economy soon tanked.

As a result Roosevelt had to reverse course in early 1938 but too late to avert another recession. Fortuitously, WW2 erupted in 1939. For the duration of WW2, the heavy deficits of the military spending supported the US economy. Because of the war exigencies, Roosevelt, unlike Obama, had congress on his side. After all no lawmakers wanted to be accused of lacking patriotism in times of war. After the war, the government substantially reduced its spending in 1946, sending the economy into another recession. This proved that the deficit spending, whether on entitlements, infrastructure or military, wasn't the real solution to the Great Depression.
Buoyed by rising incomes and profits following increased factory mechanisation, it was the private sector that took on the task of post-war spending on automobiles, homes and their spin-off stuff which had been suppressed during the war years. Businesses invested in new factories or retooled from military to civilian production. The baby boom that stretched from 1946 to 1963 further fueled the demand for schools, hospitals, suburban homes and roads.
Liberal or Keynesian economists, have exhorted the government to spend in a big way to escape from another looming depression. They have used the example of the massive spending during the Great Depression to support their case. But that example is wrong because the spending under the New Deal and during WW2 only bought time. Furthermore as explained earlier, the steep increase in the Debt to GDP % during the Great Depression was due to a measurement quirk.
Many US lawmakers are in the erroneous belief that lowering the deficit is good for the economy. Actually it would lead to a recession or more likely a depression but that's the price for the uncontrolled excesses of the past. Much worse is having a bunch of lawmakers that have absolutely no clue on the future direction of the economy.
Wednesday, December 19, 2012
The Marxhall Theory of Economic Growth and Decline
A person's view of the economy is coloured by the economic conditions prevailing during his lifetime. Even the great economic philosophers of the past could not escape the clutches of their economic environments. For that reason, we should always note the years of their births and deaths to establish how their great ideas came about. There are three peculiarities about these philosophers that conditioned their thoughts and philosophy and made them stood out from the crowd. The first is that they were keen observers of human lives and interactions.
The second is that they lived in the days of consumption always exceeding capacity mainly because of ever increasing population growth rate though there were periods, during the economic decline phase, when consumption failed. But a slowing population growth rate or, worse, a declining population was never the contributory factor. So to rely on their ideas for a solution to the current global economic crisis, which has been exacerbated by a falling population growth rate, won't get us anywhere. Theirs were valid only for their times.
As for technology, the progress was already evident in Adam Smith's time. Although the Industrial Revolution was in its early days, the fruits of the Agricultural Revolution, which actually was a precondition for the Industrial Revolution, had been evident. Factory production had also been established though still powered by water — steam powered factory machinery was only made feasible when James Watt produced a rotary-motion steam engine in 1781. Technology therefore was not a differentiating factor between then and now.
Therefore Adam Smith (1723-1790) with his Theory of Absolute Advantage and David Ricardo (1772-1823) with his Theory of Comparative Advantage were strong advocates of free trade. The British economy then was the world's leading economy, so it was to its advantage that trade was free. Also Adam Smith was, first and foremost, a moral philosopher who was more concerned with maximisation of employment rather than profit. As free trade created a bigger market for Britain's produce while enabling its workers to buy cheaper food imports, its benefits were in accord with Smith's stance. Had he lived today, he would have railed against free trade and would have certainly disowned its modern-day champions.
In military-speak, the supporters of free trade are still fighting a second generation war (2GW) in which mass bombardment is the order of the day. Now warfare is in its fourth generation (4GW), characterised by the entry of a large number of non-state combatants. If a nation-state still uses 2GW strategy to fight 4GW opponents, it's a war that the nation-state is condemned to lose, as is unfolding in Afghanistan.
Although capacity was the constraining factor then while now it's consumption, the Nikolai Kondratieff's (1892-1938) cycle of economic growth and decline was equally valid then as now. Kondratieff's argument was that overinvestment (growth phase) led to overcapacity and layoffs which reduced demand (decline phase). In this, he was roughly but not precisely right. Much better was Karl Marx (1818-1883) who was spot on but only in regards to the decline phase.
If the decline phase had been just a case of overcapacity, the climb out of the depths would've been easy because an across-the-board cut in capacity would've restored the pre-decline situation. But what makes a recovery intractable is the extreme imbalance in the suffering. Any supposed solution — deficit spending, tax on the rich, pay cut, inflation — is only a palliative measure because the extreme imbalance won't be redressed. As long as the technology remains as is, whatever money spent goes back to the rich. The only cure comes from technological progress. Joseph Schumpeter (1883-1950) coined a euphemistic term, 'creative destruction', for it. The right term is wealth destruction; old wealth must be destroyed through the introduction of new technologies so that the generation of new wealth could proceed unabated.
However, before even both Kondratieff and Schumpeter identified the technology driven solution to an economic decline, Alfred Marshall (1842-1924) had already cottoned on to this idea. The key difference between Marshall and Marx was that Marshall observed what was going in the factories. Marx never stepped foot into one. What he observed was the conditions in the Manchester slums. Had he done so, we'd have been toasting the Marxist system now.
In the first three Kondratieff waves, every time a technology solution arose, the population was ever ready to grow to absorb the increased production. Now the Fourth Kondratieff wave has again unleashed massive production capacity but this time the constraint to be unclogged is no longer technology. Instead, it's biology, to be exact, the human fertility rate. Technology cannot solve this. But technology is adapting itself to address this drastically changed paradigm. The Fifth Kondratieff wave is ushering in technologies that provide pinpoint answers to human needs. Need a component? Worry not, a 3D printer will print it, one unit only, no more no less, on the spot. Need chemotherapy? Instead of chemotherapy, molecular target therapy can precisely target the cancerous tissue without affecting others surrounding it.
Finally, the last common factor that bind these philosophers together is that they never substituted mathematics for their keen observations unlike the current generation of economists who put mathematics at the forefront of their thought process, akin to putting the cart before the horse. No wonder no great economic ideas have of late percolated from their blinkered minds. To be sure, some of the great philosophers did resort to mathematical rigours to test their ideas but mathematics was always kept in the background. Here's how, as written in Wikipedia, Alfred Marshall described his use of mathematics to support his economic ideas:
We can do one better than Marshall. Instead of using mathematics, we can resort to the plethora of patterns in the real world to illustrate the mechanics of an economic wave. For example, its 4C underpinning is based on an observation of product movements on the factory shop floor while the skewing of wealth towards the end of an economic wave is gleaned from the Monopoly board game.
Regardless, Marx and Marshall deserve the the credit for being the first to get it right, albeit each getting half right, in describing the growth and decline of an economic wave. Marx also has the last word, if not the last laugh at seeing the eventual collapse of capitalism, since he was the one who coined the label 'capitalism'.
The second is that they lived in the days of consumption always exceeding capacity mainly because of ever increasing population growth rate though there were periods, during the economic decline phase, when consumption failed. But a slowing population growth rate or, worse, a declining population was never the contributory factor. So to rely on their ideas for a solution to the current global economic crisis, which has been exacerbated by a falling population growth rate, won't get us anywhere. Theirs were valid only for their times.
As for technology, the progress was already evident in Adam Smith's time. Although the Industrial Revolution was in its early days, the fruits of the Agricultural Revolution, which actually was a precondition for the Industrial Revolution, had been evident. Factory production had also been established though still powered by water — steam powered factory machinery was only made feasible when James Watt produced a rotary-motion steam engine in 1781. Technology therefore was not a differentiating factor between then and now.
Therefore Adam Smith (1723-1790) with his Theory of Absolute Advantage and David Ricardo (1772-1823) with his Theory of Comparative Advantage were strong advocates of free trade. The British economy then was the world's leading economy, so it was to its advantage that trade was free. Also Adam Smith was, first and foremost, a moral philosopher who was more concerned with maximisation of employment rather than profit. As free trade created a bigger market for Britain's produce while enabling its workers to buy cheaper food imports, its benefits were in accord with Smith's stance. Had he lived today, he would have railed against free trade and would have certainly disowned its modern-day champions.
In military-speak, the supporters of free trade are still fighting a second generation war (2GW) in which mass bombardment is the order of the day. Now warfare is in its fourth generation (4GW), characterised by the entry of a large number of non-state combatants. If a nation-state still uses 2GW strategy to fight 4GW opponents, it's a war that the nation-state is condemned to lose, as is unfolding in Afghanistan.
Although capacity was the constraining factor then while now it's consumption, the Nikolai Kondratieff's (1892-1938) cycle of economic growth and decline was equally valid then as now. Kondratieff's argument was that overinvestment (growth phase) led to overcapacity and layoffs which reduced demand (decline phase). In this, he was roughly but not precisely right. Much better was Karl Marx (1818-1883) who was spot on but only in regards to the decline phase.
If the decline phase had been just a case of overcapacity, the climb out of the depths would've been easy because an across-the-board cut in capacity would've restored the pre-decline situation. But what makes a recovery intractable is the extreme imbalance in the suffering. Any supposed solution — deficit spending, tax on the rich, pay cut, inflation — is only a palliative measure because the extreme imbalance won't be redressed. As long as the technology remains as is, whatever money spent goes back to the rich. The only cure comes from technological progress. Joseph Schumpeter (1883-1950) coined a euphemistic term, 'creative destruction', for it. The right term is wealth destruction; old wealth must be destroyed through the introduction of new technologies so that the generation of new wealth could proceed unabated.
However, before even both Kondratieff and Schumpeter identified the technology driven solution to an economic decline, Alfred Marshall (1842-1924) had already cottoned on to this idea. The key difference between Marshall and Marx was that Marshall observed what was going in the factories. Marx never stepped foot into one. What he observed was the conditions in the Manchester slums. Had he done so, we'd have been toasting the Marxist system now.
In the first three Kondratieff waves, every time a technology solution arose, the population was ever ready to grow to absorb the increased production. Now the Fourth Kondratieff wave has again unleashed massive production capacity but this time the constraint to be unclogged is no longer technology. Instead, it's biology, to be exact, the human fertility rate. Technology cannot solve this. But technology is adapting itself to address this drastically changed paradigm. The Fifth Kondratieff wave is ushering in technologies that provide pinpoint answers to human needs. Need a component? Worry not, a 3D printer will print it, one unit only, no more no less, on the spot. Need chemotherapy? Instead of chemotherapy, molecular target therapy can precisely target the cancerous tissue without affecting others surrounding it.
Finally, the last common factor that bind these philosophers together is that they never substituted mathematics for their keen observations unlike the current generation of economists who put mathematics at the forefront of their thought process, akin to putting the cart before the horse. No wonder no great economic ideas have of late percolated from their blinkered minds. To be sure, some of the great philosophers did resort to mathematical rigours to test their ideas but mathematics was always kept in the background. Here's how, as written in Wikipedia, Alfred Marshall described his use of mathematics to support his economic ideas:
- Use mathematics as shorthand language, rather than as an engine of enquiry.
- Keep to them till you have done.
- Translate into English.
- Then illustrate by examples that are important in real life.
- Burn the mathematics.
- If you can't succeed in (4), burn (3). This I do often.
We can do one better than Marshall. Instead of using mathematics, we can resort to the plethora of patterns in the real world to illustrate the mechanics of an economic wave. For example, its 4C underpinning is based on an observation of product movements on the factory shop floor while the skewing of wealth towards the end of an economic wave is gleaned from the Monopoly board game.
Regardless, Marx and Marshall deserve the the credit for being the first to get it right, albeit each getting half right, in describing the growth and decline of an economic wave. Marx also has the last word, if not the last laugh at seeing the eventual collapse of capitalism, since he was the one who coined the label 'capitalism'.
Subscribe to:
Posts (Atom)