The best gauge of the state of the US economy can be divined from the state of its politics. And judging by the day by day weakening position of Obama, we can be fairly certain that its economy is headed for the rocks. As its politics continues to be undermined by its economics, the chances of the bumbling Obama being impeached before long look like a real possibility. Tellingly, it's the Russian president that may offer him a way out of an embarrassing congressional vote loss.
A look into the latest economic indicators would confirm the dismal outlook for the US economy. The just released second revision of the US Q2, 2013 GDP registered an upwardly revised 2.5% growth. As usual, because it's computed based on current quarter over previous quarter growth compounded four times, that number is exaggerated. The actual figure, computed using current quarter over same quarter last year, would have shown 1.6%.
Parsing the GDP into its constituent components would uncover the real story. Only then can we determine whether growth is sustainable. The main independent drivers of the US GDP are actually two: government spending and business non-residential investment. Personal consumption, although contributes to 68% of the US GDP, is largely overrated as it depends on consumers having incomes from business and government spending.
Unfortunately, business operational spending doesn't appear in order to avoid double counting. Only investment spending counts but this alone is enough to point to the future direction of the economy. Government spending can also influence GDP growth but it lacks the ability to provide a clue to the future. Business invests when it senses future growth and this is based on a growing order book. Government on the other hand spends regardless of future tax receipts. In fact it doesn't know how much its future revenues will be.
There's another category of spenders, that is, investors looking for growth assets. Normally, this category of spenders doesn't affect GDP because they buy existing assets but in these abnormal times, their financial muscle can lead to speculative rises in asset prices which in turn stimulate spending on new assets, specifically on residential property construction. We will observe how their search for growth in times of wealth destruction in two countries, the US and the UK, leads to two contrasting actions but in the end, the outcomes will still be the destruction of wealth.

Government spending has been decreasing in real terms since 2010 but this has been offset by the increase in investment. Now business investment has started to follow suit with reducing growth as businesses now realise that without government deficits, demand will falter. This is in accord with our Monopoly board game pattern in which the players stop buying properties or building houses or hotels when the game is finishing.
Personal consumption (not shown) also has registered slowing growth over the last 4 quarters while net imports have declined by 11% since the peak in Q2, 2010; this partly explains for the troubles erupting all over the world. The only outlier is residential investment and the main culprits for that are the speculators and investment funds. That also is ending as evidenced by new home sales which plunged 13.4% in July. Our trio of Case-Shiller charts below confirm that the turning point in residential investment has been reached.

The right chart topped in May 2013 while the middle chart peaked in June 2013. The left chart will turn a corner in the next 3 to 4 months. Our target is still a 50% decline from the July 2006 record peak. In the last few months, the trend was temporarily reversed by the distortion created by the sudden inflow of speculative money hunting for gains. Now that the speculative funds have discovered the gains are illusory, home prices will continue their customary declines. What's left for the speculative money are investments in oil, stocks and bonds. These will also fall in time to complete the wealth bust that marks the end of the 4th Kondratieff Wave.
While in the US, the private equity firms are responsible for escalating home prices since the end of 2012, in the UK, the government is fanning a housing bubble. Since the UK government has chosen the austerity path, there's no economic growth other than that created by a housing bubble.
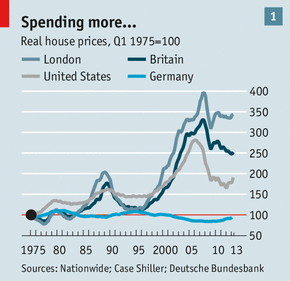
Even the two Economist charts below show that the UK economic recovery has been far weaker than the US recovery given that its investment has collapsed. George Osborne, the Chancellor of the Exchequer, was kidding himself when he claimed that UK's austerity measures were a success. In these end-of-cycle times, no measures can be called a success. Stimulus only buys time and store up more troubles ahead while austerity delivers immediate failure.

Indeed 9.7 million households in the US are still under water. In the UK, two programmes, Funding for Lending and Help to Buy, to facilitate home purchases are responsible for the continued increase in UK home prices. One programme helps the financier by giving them access to cheap credit. The other assists the buyers by giving government guarantee for loans and enabling the buyers to put down a 5 percent deposit on a newly built property.
The situation in the UK is more pressing as its government is relying solely on the home property market to shore up the economy. But it's not surprising given that the UK economy has been reliant on the financial services industry since Thatcher's days. As financial services all over the world continue their shrinking act, economies with significant exposure to such services will suffer greatly. David Cameron should have called for an early election early next year while the going is good.

Now in any country, whenever there's growth, the credit outstanding will likewise increase. China's August sales industrial output increased by 10.4% and auto sales by 11%. Check! Its new credit doubled over that of previous month. US auto sales continue to increase month after month. Check! Leases (with no ownership rights) made up 26% of sales as compared to 20% before the recession and auto and student loans keep on reaching new highs at the expense of credit cards (see Bloomberg chart of the auto loan secondary market at left and Quartz chart below for new auto loan debt). The American consumers are tightening spending on goods and services in order to splurge on auto.

Beyond the pretense of growth, the economy is actually surviving on debt support. As we remember the 5th anniversary of the recession, bear in mind that it's debt that we should be actually feting.
No comments:
Post a Comment