Showing posts with label oil. Show all posts

Wednesday, November 9, 2011

Rise by the oil, fall by the oil (Part 2)

The first phase of Thatcher's administration (1979-1983) succeeded in subduing inflation even though total debt, i.e., money, grew. Inflation thus is not only a function of monetary growth but also of energy costs, primarily, oil. However the inflation fight was at the expense of the unemployment rate (see chart below from Paul Maunders blog) which remained stubbornly high.

Thatcher had to get the unemployment rate down to provide evidence of success for her economic policies. The easiest way to achieve growth was to unleash credit but first, Friedman's monetarism theory of stable monetary growth had to be permanently ended. The Bank of England did its part by officially abandoning monetarism in 1986. The US government had already turned on the monetary tap in 1984, thus securing Reagan his second term.

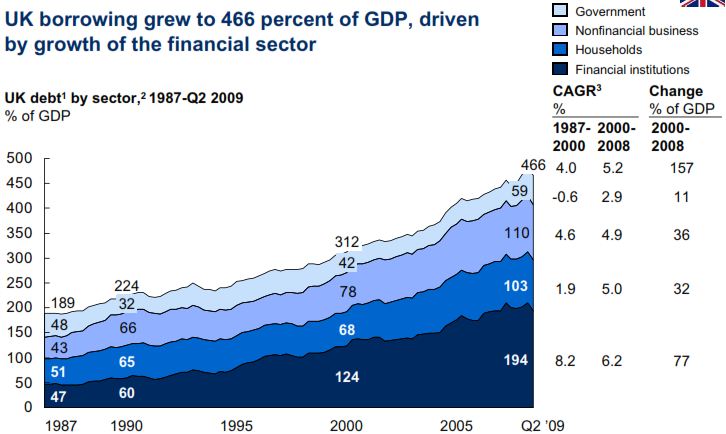
Unfortunately I've not been able to find the chart that plots the 1986 credit increase for the UK. The best that I've got is the earlier chart shown in Part 1 of this story which ends in 1985. Its follow-up chart (see below, also McKinsey's) however begins from 1987, leaving a gap for 1986. Regardless we can interpolate to find out what transpired in 1986. The UK's total credit as at end 1985 was slightly below 150% of GDP while that for (probably end) 1987 was 189 percent. So within two years, credit as a percentage of GDP grew by around 40 percent. That is a blistering pace that would have rocket-propelled any economy. The other thing about the chart that strikes the eye  is the relentless growth in credit up until the onset of the current crisis. That strongly explains why Tony Blair, like Thatcher, also managed to hang on to three terms. One thing for sure, the successive British governments have been running the country into the ground as the price for keeping up with the major powers. The mess has now dropped into David Cameron's lap who is certain to be overwhelmed by the sheer scale of the total debt level.


Back to Thatcher, in her second term, she accomplished several noteworthy achievements. First she managed to break the back of the trade unions when the coal miners' union gave up their strike in March 1985. She also carried out large scale privatisation of nationalised industries. Estimates of the privatisation proceeds have ranged from £19 billion to £29 billion.

However in 1986 the monetary value of Britain's oil production collapsed following Saudi's price war to spite the non-OPEC interlopers. Without the backing of the oil wealth, Thatcher had nothing to show for all the hardships of monetarism induced inflationary busting. So something had to be done not only fast but fast enough to bear fruit before the next election. The base interest rate was the tool: from a high of 14% in January 1985, it bottomed out at 7.5% by May 1988 (see chart above from www.houseweb.co.uk).

Her earlier privatisation of the nationalised industries and enfeeblement of the trade unions were expected to boost productivity which would unleash the goods supply to match the increased credit supply. This would also reduce unemployment just in time for the next election. Theoretically, that was how it should work but in reality, Britain's goods production had been severely impaired through neglect that the only growth for the economy was in the financial services and non-tradable real estate sectors. The eclipse of manufacturing was not entirely due to Thatcher's earlier contractionary monetary policy; the British firms had failed to invest at the same pace as Germany's or Japan's. Furthermore, Britain's petro economy had fostered a strong currency that remained so until early 1985, making exports non-competitive for its manufactured goods.

The credit growth that lasted from 1986 to 1990 was emblematic of Thatcher's trial-and-error experiment with the British economy. Her accomplice in this scheming was her Chancellor, Nigel Lawson who dismantled all financial barriers and regulations with the 1986 Big Bang. Lawson also brought down the basic tax rate from 30% in 1986 to 25% by 1988 and the top rate from 60% to 40%.

Thatcher and Lawson opened the gate for the foreign banks to set up shop in London much as the developing countries wooed the goods producers from the developed world to establish factories on their soil. It was hoped that financial services would take over from manufacturing as the country's biggest economic driver and turn London into a global financial centre. However, financial services could never replace the goods exports lost to the new manufacturing upstarts from Asia. The above chart from www.economicshelp.org proves that Britain has never been able to regain her manufacturing competitiveness that was lost way back in the early 1980s.  It was estimated then that financial services exports would have to increase by 10% to make up for a 1% drop in manufactured goods exports.

Banking unlike manufacturing however is a very dangerous game. In manufacturing, during a recession, a major producer that packs up and closes shop will disrupt only the local supply chain and employment. In financial services, because of the widespread lending between financial institutions, a failure of a major bank can pull down the others unless the government steps in to take over the debts. This wholesale crash will cause the money supply to collapse and seize up the economy.

It is true that currently a large share of the assets, i.e., loans disbursed, of the British banks not only are made abroad but are also supported by borrowings from abroad: Table 9D of the Bank of International Settlement statistics as of 30 June 2011 shows that foreign banks' claims on UK borrowers amounted to US$3.06 trillion (second only to the US) while British banks' claims on foreign borrowers totalled US$4.18 trillion (biggest in the world). Regardless, the aphorism, attributed to J. Paul Getty, that when you borrow small, the problem is yours, but when you borrow big, the problem is the bank's, rings true for Britain's debt situation. Given this disproportionate dependency of the British economy on financial services (see how much the yawning current account goods deficit gap was closed by financial services in the above chart), Thatcher's promotion of financial services will in time come home to roost in the coming Grand Depression.

But Thatcher herself didn't have to wait for the coming Grand Depression. The quick-fix boost to the economy enabled Thatcher to be elected for a third term in 1987. Britain's house ownership at around 70% ranked among the world's highest, making the public eager voters for Thatcher's Conservative party. However the good times would soon be over, marking her third term as her downfall phase. The easy money had resulted in a capacity constraint that was followed by a surge in Britain's current account deficits and higher inflation (see chart above). To subdue inflation, the base rate was doubled from 7.5% in May 1988 to 15% by October 1989, bursting the housing bubble. Unemployment crept up to its pre-boom level. However inflation took two years after the peak of the interest rate hike, to be contained. Worse, with the oil prices still in the doldrums, Thatcher no longer had the luxury of oil wealth to appease the public with increased social security and unemployment benefits.

The trap had been set for Thatcher to stumble into. It just needed only a trigger. She survived the poll tax riots in March 1990. But the general unfavourable economic conditions made it tougher for her to ride roughshod over her Tory colleagues without creating deep animosity. They needed a bone to pick with her. Her strident stand against increasing European encroachment on Britain's sovereignty became their cause.  Feeling that she might lose the second round of a leadership challenge, she voluntarily resigned her premiership in November 1990. What an ignominious exit, three consecutive wins at the polls, only to be stabbed in the back by party colleagues.

Had Thatcher restricted herself to two terms, like Reagan, she would have stepped down with her reputation held in high esteem. The British public would be now yearning for her leadership although in reality, she benefited largely from factors beyond her control, especially the oil wealth. Without its crutch, her downfall was predictably swift.

Monday, October 31, 2011

Rise by the oil, fall by the oil (Part 1)

We've seen how Ronald Reagan benefited from the drop in oil prices (see "Great in debt") to secure a presidential second term. Margaret Thatcher, his political soul mate, also profited from oil but in a contrasting fashion. It's doubtful whether they were aware how their fortunes had been closely tied to swings in oil prices.

Oil's tentacles go beyond deciding the fates of petro-state politics. Even great leaders of the western world survived on the indulgence of oil. Had Reagan been in Carter's shoes, he would have faced the same travails that had plagued Carter with equally limited options of wriggling out. Reagan avoided the fate of Carter because oil prices were trending downwards towards the end of his first term as a result of falling consumption following the long recession from July 1981 to November 1982. The cause was the high contractionary interest rates imposed by Volcker. To his benefit, oil prices stayed low throughout the second term of his administration. This time it was the Saudis who precipitated the price fall by suddenly unleashing output from two million barrels per day (mbpd) to five mbpd.

Reagan's successor George Bush the first might have earned his second term had he not raised taxes and had the Savings and Loan financial institutions not imploded, the implosion itself a consequence of Reagan's deregulation. These two events resulted in a pullback of the money supply growth, effectively scuttling Bush's reelection hopes. The oil price then wasn't a spoiler as its price was still benign except for a short-lived spurt as a result of the first Gulf War.

Thatcher's fortunes however differed. Whereas the US presidents needed cheap oil for economic prosperity, Thatcher depended on expensive oil to sustain Britain which was gradually losing competitiveness on its manufacturing front. Thatcher's predecessor, James Callaghan correctly predicted that the winner of the 1979 election would stay in office for a long time, reaping the benefits of the oil revenues which were about to pour in. He didn't need any clairvoyance as Britain's North Sea oil which had been first discovered in the early 1970s was subject to the usual lead time of 7 to 10 years from discovery to production (see chart above). Thatcher came in at the right time to hold the premiership for more than 11 years.

Now oil has always been subject to great price swings. So were Thatcher's fortunes. The significant drop in oil production and exports in the early 1990s (see left chart) correlated with Thacher's resignation from the premiership on 28 November 1990.

So it appears that Thatcher's great standing rested entirely on oil. How about her economics ideology which initially relied on Milton Friedman's monetarism? She was said to have successfully tamed inflation. Like the oil story, we can set the record straight since most people still think that defeating inflation is a matter of just hiking the interest rates up. Friedman would have recommended restricting the supply of credit rather than manipulating its price, that is, the interest rate, but Friedman's approach would have caused a sudden shock to the credit supply that all developed economies have now abandoned it.

Thatcher, although a novice at economics, was a consummate politician, ever willing to ditch any economic ideologies at the first sign of voters' discontent, particularly nearing an election year. Unfortunately, the British public had to become guinea pigs for her Friedman-influenced monetarist ideas. To suppress inflation, she started off not only by raising interest rates to 17% in 1980 but also drastically reducing public spending in her first budget. The impact was immediate. By the following year manufacturing production fell by 14% and unemployment rose to 2.7 million. British manufacturing capacity shrunk by 25% in 1979-81. Not only that, influenced by Friedman's Chicago liberalism doctrine, she also abolished the controls on capital movement. This is one measure that all countries will come to regret 30 years later with the onset of the Grand Depression.

The austerity measures were driving Britain into bankruptcy. Only the North Sea oil was keeping Britain solvent. Soon Thatcher became the most unpopular Prime Minister in British history. Unemployment hit the Black minorities disproportionately, eventually boiling over into the summer 1981 race riots in several British cities. Thatcher quickly reversed course by ditching Friedman's monetarism temporarily. It is sad to find that politicians, including Britain's very own David Cameron, still believe in austerity measures when history has proven them to be a complete failure.

By autumn 1981, Thatcher started cutting interest rates. In the following year's budget, Thatcher increased public expenditure. With the high number of the unemployed, it was not surprising that inflation remained low. Oil prices were also moving downwards. More importantly, the British economy was increasing its money supply (see chart below from McKinsey). It should also be noted that the previous British governments since the World War II had to contend with high public sector debt. So they resorted to inflation to bring the share of public debt down to manageable level. Thatcher benefited greatly from her predecessors' efforts, enabling her to start pumping credit again, though this time using households and financial institutions to undertake the borrowings. This recovery and the euphoria from the Falklands war victory enabled Thatcher to retain her premiership in the 1983 election.


The impact of the inflation especially in the 1970s helped to whittle down the real value of debt. As seen in the chart below (again from McKinsey), debt or credit has always been on the increase. Any political leaders thinking of crimping the total credit growth are dangerously courting a total social breakdown. Only inflation could ameliorate a debt growth. Consequently, the inexorable rise in UK's total real debt level beginning from the Thatcher's administration can be attributed not in a small way to the low inflation conditions prevailing since then.


Since Thatcher's story has many interesting lessons for our bumbling EU politicians, we'll continue the second part of the story with the conditions leading to her downfall.

Monday, October 10, 2011

Great in debt

It is said that Margaret Thatcher and Ronald Reagan were the two great leaders of the western world in the 1980s, instrumental in ending the Cold War and ushering in a new era of small government, low taxes, free trade, weak union, prosperity and freedom. With the current palpable lack of leadership in the major economies, the public is yearning for the good old days of Reagan and Thatcher.

We don't want to revisit the legacy of both leaders; that would be the job of historians. Indeed they were truly admirable. But were there to be a leader of similar ability, could he or she reach the great heights of global stature especially in these trying times? Or was there something else about Reagan and Thatcher that has yet to be made known to us, the gullible public?

With the benefit of hindsight and a vast treasure trove of information on the web, we can now reexamine the reasons behind their prominence from the perspective of the 4C (see "Reality in 4C"). You should have been aware by now that Reagan secured his second term by paying homage to the credit market. But let's get into the details to debunk the conventional wisdom surrounding Reagan first, to be followed by Thatcher in a future post.

We begin with the tax and spending cuts, two issues frequently cited by the Republicans to justify their calls for similar action by Obama. When Reagan came into office in 1981, he reduced the top marginal tax rate from 70% to 50%, and federal spending by almost 5% of the federal budget. However this step could only last one year as coupled with Volcker's high fed funds rate that topped 19%, the economy was plunged into a recession (see left chart from The New York Times). The fall in inflation rate following Volcker's tight money policy accentuated the fall in the tax intake. So Reagan had to reinstate the tax revenue in 1982 not by reversing course but by transferring the burden onto businesses. Still, his tax cuts were much more than the increases; by the end of his administration the top marginal rate was further reduced to 28%.

The result of the tax cuts was reflected in the ballooning federal deficit, tripling from US$900 billion to $2.7 trillion by the end of his administration (blue column on the left chart). However this deficit actually boosted the economy. It supplied the spending and liquidity that uplifted the incomes of households, businesses and foreign nations. In turn the businesses and households took on higher borrowings of their own, resulting in a spike of total US debt that started from the end of Reagan's first term.

Now, two questions remain a puzzle to most observers of the Reagan administration. First, can't we continue the borrowing binge by all sectors that brought prosperity not only to the US but also to the whole world? Second, why was the inflation subdued when in fact the money supply as reflected in the debt increase during his second term was skyrocketing? Nobody has satisfactorily addressed these issues. Our attempt will demonstrate that Reagan came into office at the most propitious time. Because of that, his mistakes, which would have been calamitous to any other president, were glossed over.

He gained much from the cautious policies of his predecessors. Not only were they conservative with deficit spending but the inflationary conditions that had characterised their presidencies reduced the relative level of the federal debt. For example, Carter increased the federal debt by about 30% but because of the inflationary condition, the debt/GDP ratio actually decreased by 3.3%. Reagan's two terms however marked a new era of debt financing, not only by the government but also by the other sectors: businesses and households. Reagan took advantage of the depressed borrowings of the earlier years to let rip the borrowing and spending spree.

Also, unlike Nixon, Ford and Carter, Reagan didn't have to endure periods of high inflation, commonly known as stagflation because of the stagnating GDP. Milton Friedman used to remark, erroneously in fact, "Inflation is always and everywhere a monetary phenomenon." It should have been a 4C phenomenon instead of only a monetary phenomenon. The other important factor is capacity in which oil plays a very significant role as the driver of virtually all economic activities.

Remember that oil prices started to experience wild swings following the 1973 OPEC oil embargo. In fact, the sudden jump in prices wasn't totally unexpected had the buyers observed the declining spare capacity leading to the embargo (see "Oiled for Turmoil"). But as new oil fields took at least 7 to 10 years from initial exploration to production, it wasn't until the early 1980s that these fields managed to boost the spare capacity. However the 1979 Iranian Revolution followed by the Iran-Iraq War in the following year further scuttled oil production leaving the Carter administration wondering why his increased spending didn't translate into higher economic growth instead of higher inflation.

Only in 1985 did the prices drop to US$26 per barrel and by the following year to as low as US$11. Until the end of Reagan's second term the prices remained favourable, hovering around US$20. So Reagan could have the cake and eat it too, his spending going straight into the consumers' pockets instead of the oil producers'. Production capacity could increase to take care of the spending when previously any increase was constrained by higher input costs.

These two factors explain why no one else can repeat Reagan's feat and why there is so much yearning for Reagan's leadership. Although oil prices will likely go down as vast new fields in North Dakota, Colorado, North Sea, Colombia and Brazil's coastal waters come onstream in the next couple of years, the debt could no longer be increased. It has reached the peak of the S-curve and the only way forward is down. Those who want to spend no longer have the income to afford the debt while those who have the means have no use of further borrowings.

Poor Obama, intelligence alone is not enough to guarantee good leadership. More important is the external environment which in these troubled times can do far more to make or break a leader.

Monday, November 16, 2009

Oiled for turmoil

Oil is getting scarcer but demand is increasing at an alarming rate. Peak oil has already been reached, production will soon decline. Ergo the high oil prices. Certainly a grim narrative for oil consumers. Except that it's untrue. The bleak outlook will instead redound on the oil producers.

Actually, the oil business is turning into a sunset industry. New technologies are discovering new vast reserves faster than can be consumed. As for old and plugged fields, they can now be brought back to production with new recovery techniques squeezing more oil that heretofore remains unrecoverable.

Capitalism leaves in its wake a history of broken constraints. In the case of oil, there are two ways in which oil supply constraints can be smashed. Both involve the use of new technologies. One will enhance the prospect of discovering new fields and recovering more oil from the fields, including those that have been long abandoned. The other, part of the final technology wave, will make oil obsolete and redundant.

On the surface, although oil prices appear as the product of supply and demand, things are not that straight forward. Looking back at the history of oil prices since October 1973, when OPEC started flexing its muscles, oil prices have usually been a product of the interplay between global liquidity and the follies of the oil producers. On the way up and down, they move in tandem, continually reinforcing each other. The wild swings in oil prices are the inevitable outcome of the commodity nature of oil. It doesn't take much to tip the scales in favour of either the consumers or producers; the marginal price sets the price for the entire market since the market is not segmented. Worse, both supply and demand are not that elastic over the short term.

In the immediate term, even without factoring the new technologies, the outlook for oil prices is downward. Because bringing new oil fields to production takes time, anywhere from 7 to 10 years, these fields, the planning of which began in 2003 when oil prices inched upwards, will start producing by 2010. Foreign Affairs Nov/Dec 2009, disclosed that Saudi's production capacity would rise from 9.5 million barrels a day in 2002 to 12.5 mbd in 2010, with an extra 1.0 mbd on standby. By then, total OPEC production capacity will grow to 37 mbd, giving a spare capacity of 6 to 7 mbd over current production level. All this is happening in the face of a massive global economic slowdown.

Twice in the past, as narrated by Foreign Affairs Mar/Apr 2002, Saudi used its spare capacity to discipline wayward oil rivals. In 1985/86, Saudi intentionally engineered a price war to regain its market share from interlopers. More than ten years later, in 1998, again it purposely added another 1.0 mbd to its production to punish Venezuela for displacing it as the prime supplier to the US. But the authors of that piece ignored the events leading to the two price collapses that had taken place a few years earlier. The chart shown here from The Economist is enlightening.

Prior to the Arab Israeli War in 1973, the oil spare capacity had been on a secular fall while production - and, by inference, consumption - had been rising, Surely, such opposing trends would have signalled a price increase in the near future. On the other side of the globe, another war had been draining the US of substantial funds that by August 1971, Nixon had to de-peg the US dollar from the gold standard. Free from its leash, the total debt level (money supply) in the US leaped. The 1973-74 oil shock, wrongly attributed by many to the Arab oil embargo, wouldn't have been a shock had the policymakers been aware of the rapidly declining spare capacity as well as the depreciating value of the US dollars. The sudden jump in oil prices from US$3 a barrel to US$12 was an otherwise predictable event. In the 1967 Arab Israeli War, the Arab countries also imposed an embargo but it came to nought. Why? Because spare capacity was still high; even the US then was a net oil exporter.

However at US$12-US$14, there was no much incentive to develop new oil fields. Oil spare capacity was still hovering around 5 percent of production. It needed the Iranian revolution and the subsequent Iran-Iraq war to secure a production fall of more than 3 mbd and thus jolted the prices to US$38 a barrel by end 1979. At this new price, consumption dropped through energy efficiency measures but not in an appreciable manner. More momentous was the spike in spare capacity as all producers ramped it up to capitalise on the high prices. Gradually, the prices dropped to US$26 by 1985. Saudi, being the swing producer had to cut production from 10 mbd to less than 4 mbd in order to stabilise prices. Seeing that others were profiting at its expense, it suddenly surged production to 5 mbd in early 1986. Within a year, prices slumped by more than 50 percent, dropping to as low as US$11.

Spare capacity dropped steadily all the way to 1990. Because of the long lead time in the development of crude oil production, spare capacity cannot jump or slump suddenly. Not however actual oil production . When Iraq sparked the first Gulf War by invading Kuwait on 02 Aug 1990, oil prices bounced back to US$38 but this was shortlived as Saudi jacked up production from 5 mbd to 8 mbd to appease the coalition countries which expelled the Iraqis.

The prices moved within a price band of US$15-US$23 from 1991 to 1997. Spare capacity was subdued at 5 percent. This was a period when supply and demand reached a stable accommodation. From now onwards, the oil producing countries no longer maintained spare capacity as a matter of policy. Any increase in spare capacity will be a result of a consumption slowdown. When the financial crisis hit East Asia in 1997-1998, global oil consumption for 1998 stagnated and spare capacity increased. Venezuela increased its shipments to the US to dethrone Saudi as the biggest OPEC supplier but Saudi retaliated by jacking up production by 1 mbd. Prices collapsed to US$9 by end 1998 and early 1999.

The 2000 dotcom boom pushed prices to over US$30 but they fell back to US$16 the following year with the dotcom crash. The spare capacity yo-yoed from 1998 to 2001 because of these economic crises. Beginning 2002, Greenspan and Bush participated in the biggest US credit creation that ended in 2008. Prices peaked at US$143 by June 2008 but dropped to US$34 by winter. Spare capacity was dangerously low. Obama's public stimulus (the biggest in US history), Bernanke's money printing and Chinese easy credit revived the prices to US$80 by late 2009. These not only benefit oil exporters but also countries, such as Australia, Brazil and Indonesia that depend on other extracted commodities including coal. Their economic growth is by no means a reflection of their management of the economy.

As the world approaches 2010, these band-aid measures will start to wear off. And spare capacity for OPEC itself will exceed 10 percent. In 2008-2009, two years in a row oil consumption fell, the first time since 1982-1983. In 2010, it's likely to fall unless the US institute another trillion dollar budget deficit. The outlook for oil certainly looks very gloomy.

Will oil production drop in order to prevent price collapse? Possible but highly unlikely. The producers are caught in a trap of their own doing. Almost all the major exporters have populace that is dangerously dependent on oil largesse through government jobs and spending. This is a fixed cost that cannot be crimped without severely exposing the governments to social instability and political upheaval. As prices drop, they will rev up production to keep revenue steady. Soon, this vicious circle feeds on itself until the country itself succumbs to economic and political collapse. Although oil will be cheap, it's not oil but blood that will be spilled in the streets.

Remember the Eastern European communism collapse and Soviet withdrawal from Afghanistan in 1989, and Russian financial crisis and Suharto's fall from grace in 1998. Their root causes lay in the oil price collapse. Take Indonesia. Like the other South East Asian countries, it suffered from an overvalued currency then but buffeted at the same time by low oil prices and El Nino-induced rice crop failure, the ensuing carnage was total. Even now the rupiah exchange rate tracks the oil price movement.

As an aside to the main topic, certain commentators, some of whom are economists, have attributed the present recession to the high energy costs, specifically those based on oil. Yet more ridiculous are those who blame the expected declining oil production as a leading cause for the recession. These conjectures reflect a flawed reasoning arising from confusing cause with effect.

If you recall the investment clock (see Ticking towards midnight), high commodity prices immediately precede the deflationary crash. Inferring that A causes B just because A precedes B is a flawed reasoning known as post hoc (after this) reasoning. A fitting analogy is a rooster's crow at the break of dawn which in no way causes the sun to appear. Actually high commodity prices is symptomatic of massive credit creation and when this credit is later written off because the borrowers cannot repay, the whole economy collapses.

As for the declining oil production Chicken Littles, they should read Scientific American October 2009. The magazine describes the new technologies that will extract more oil from the fields. Right now, only 35-40 percent of the oil in the average field is recovered; the rest remains unrecovered. New recovery techniques using heat, chemicals and microbes allow us to go after this buried wealth. Moreover, for new fields, only one third of the world's sedimentary basins - geologic formations that may contain oil reserves - have been thoroughly explored using modern technologies.

A recent example in the natural gas reserves is instructive. Hydraulic fracturing, a new technology that injects water and chemicals at high pressure to break shale rocks that trap natural gas, has been attributed to a 35 percent jump in the US gas reserves in two years. A similar thing is happening to oil reserves. The fact is more oil is still untapped and peak oil is rather more of our psychological fear than of physical reality.